Composing Concurrency-Friendly Scenes
Contents
Understand scene throughput and how identify bottlenecks
In Geolib3-MT, system throughput is defined as the number of scene graph locations that are processed per second. In processing a given scene graph the moment-to-moment objective is to either maintain or increase the Geolib3-MT processing throughput.
Location Bottlenecks
In a typical scene, some scene graph locations will take longer to compute than others, this is normal and expected behaviour of scene graph processing. However, these expensive-to-compute locations can become systemwide bottlenecks when subsequent locations depend on their results.
To provide a concrete example, in the following example OpScript_lsysString
produces a costly L-system description at the scene graph location
/root/world/geo/lsys. The node OpScript_lsystem then processes this
description to build a graphical representation of the tree.
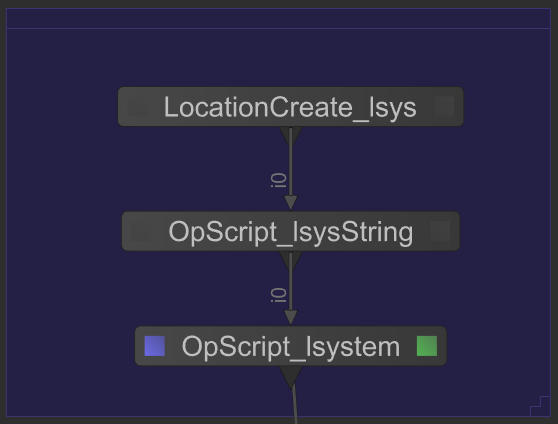
Because the work of OpScript_lsystem is entirely dependent upon
OpScript_lsysString, processing of the whole scene graph is stalled until
/root/world/geo/lsys is computed by OpScript_lsysString. The resulting
throughput when processing this tree is approximate to:
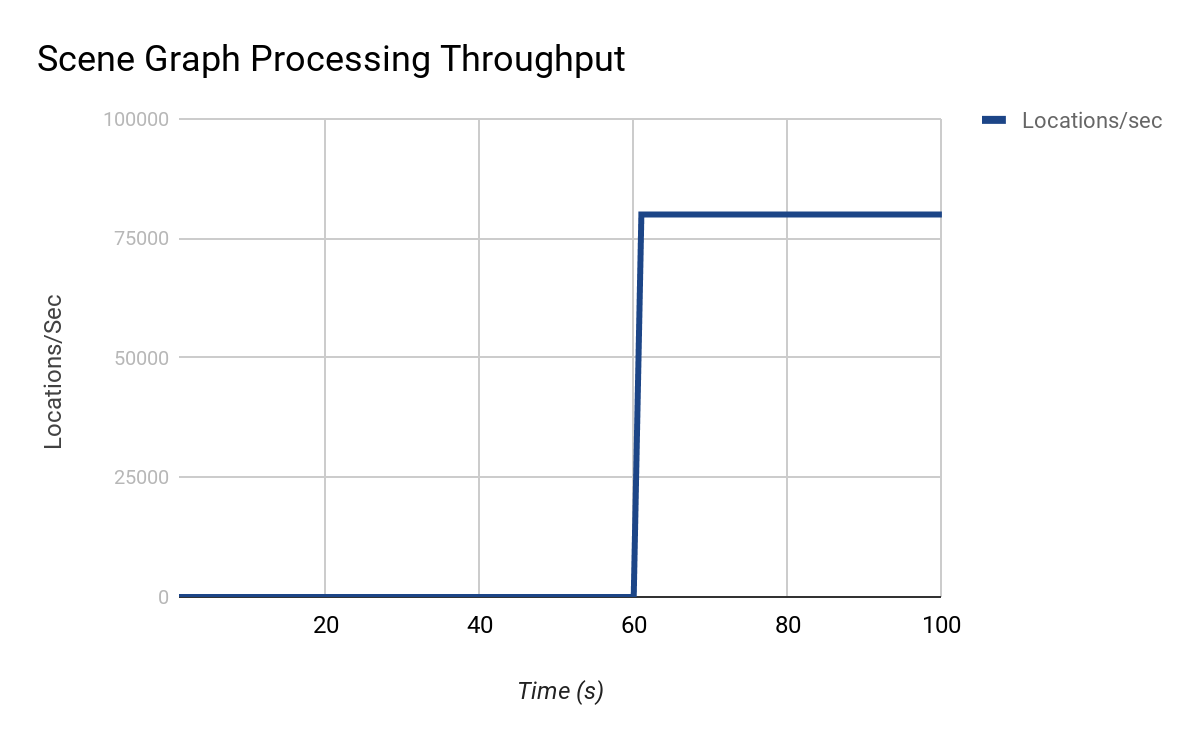
On initial inspection it could be reasonable to assume the processing between 0-60s is bounded by a mutex or serial code. But, as previously discussed, this is actually a very costly location upon which the rest of the scene depends on. What options exist to address scene bottlenecks like this?
First, we can use the Op tree profiling tools shipped with Katana 3.5 to identify costly Ops in the scene. Using this information we can seek to optimize the performance of those costly Ops. Optimizing these Ops will largely depend upon the nature of the work they’re doing; but as with any optimization task, first identify an optimization target, measure, refactor and re-measure.
It may be possible to entirely remove the bottleneck by just optimizing one or two key Ops in the Op tree. This was the case in the above example in which careful use of Lua object creation significantly reduced the time to compute the L-system description. However, sometimes we must accept the operation simply is costly; in this case, what options exist to help maintain scene processing throughput?
The next step is to examine the processing problem itself, can it be broken down into smaller, logical chunks that could be linked or indexed by scene graph locations. Effectively using the scene graph topology to represent a parallel processing task graph where each child represents a subsection of the work that can be processed in parallel.
For example, say we need to compute the first 1000 prime numbers. We could
create an Op that at the location /root/world/geo/data/primes calculates
each prime in turn and stores them as an IntAttribute. Alternatively, we
could create an Op that creates 1000 children under
/root/world/geo/data/primes, each child’s position serving as the index to
the prime series. At those children, the Op would then compute the prime at
that point in the series. In this example, Geolib3-MT is able to take
advantage of the parallelism available within the scene graph to schedule
each child to run in parallel.
An extension to this approach is also provided in Use Merge branches for computationally independent scene graphs in which computationally intensive work is broken up using the op tree and the results collated using a Merge node.
Finally, you can use knowledge of the scene traversal pattern to your advantage. Geolib3-MT will complete a breadth first expansion of the scene, thus, if there exists a computationally expensive scene graph location, consider placing it under a scene graph location with a number of other children which can also be processed in parallel. Then, whilst one location may take longer to cook, it does not prevent the other locations - indeed, the rest of the scene graph - from being evaluated.
Processing Capacity
Scene throughput can be bounded by processing capacity. If there are more scene graph locations to be processed than available CPU cores, we would expect to see complete utilization (saturation) of available cores and a backlog of scene graph locations awaiting processing. In general, adding more cores should help reduce scene graph processing time.
Conversely, if the available computing resources are able to process scene graph locations faster than new locations become known, or, if the scene simply does not contain a large enough (“large enough” also depending on what processing Ops in the Op tree are doing at each scene graph location) number of scene graph locations to keep all cores utilised you may benefit from reducing the number of cores available to fully utilise those cores. From a performance standpoint this may be beneficial when combined with a CPU pinning strategy which could potentially improve the L2/L3 cache performance.
Summary
Scene throughput can provide a good indicator of processing performance. Understand the throughput of your scene. Are some locations or Ops a bottleneck to improved performance? Or, is scene processing currently bounded by CPU processing capacity?
As a general rule, aim to maintain or improve the moment-to-moment locations per second processing rate. A simple average can give an overall indication of scene performance (total locations divided by total time to process); more accurate, moment-to-moment results can be achieved by appending a terminal Op to keep track and periodically reporting the scene processing throughput to the console/file for later analysis.
Identify indirect use of mutexes and other synchronization primitives
Mutexes and other synchronization primitives that enforce serialized execution of code can have a significant and negative impact on scene graph evaluation performance. Whilst it may be straightforward to identify mutexes in your own code it can be more problematic in third-party code and libraries.
Symptoms that Ops in your scene may be indirectly calling code wrapped in mutexes or critical sections range from,
Increasing the number of threads/cores available for scene processing increases, rather than decreases, scene graph expansion and time to first pixel.
Messages in the Render Log that indicate a thread-unsafe Op has been called.
Multiple threads/cores available for scene processing but only one or two cores actually utilised.
Alembic HDF5 to Ogawa
To provide a concrete example, Alembic caches can be stored in two formats, HDF5 and the newer Ogawa format which was designed to support parallel scene traversal. Whilst no messages will be printed to the Render Log when reading HDF5 formatted caches, the scene traversal time will be significantly slower and performance may even degrade when more threads are added. In a test scene with approximately 140k locations, converting an existing HDF5 cache to Ogawa saw a reduction in scene traversal time from 26.2s to 3.9s with a 32 core task pool available for processing.
The Alembic library provides a utility to convert Alembic files from HDF5 to Ogawa, called abcconvert. This utility must be built from source; this source can be found at https://github.com/alembic/alembic/tree/master/bin/AbcConvert, with instructions in the root of the repository.
Once built, abcconvert can be used from the command line as follows:
cd /path/to/build/directory
abcconvert -toOgawa -in <input file> <output file>
abcconvert will do nothing if the input file is already in Ogawa format.
Fall back to the Classic Geolib3 Runtime
In some cases, the Geolib3 Runtime (the “Classic” Runtime) that was distributed with lines of Katana releases prior to Katana 3.5 may have better performance than the Geolib3-MT Runtime. This may be the case, if for example:
The Op tree contains a number of Ops that have been marked thread-unsafe, and these Ops limit scene traversal throughput; or
The scene has previously been optimized against the Classic Runtime and an in-house multithreading solution.
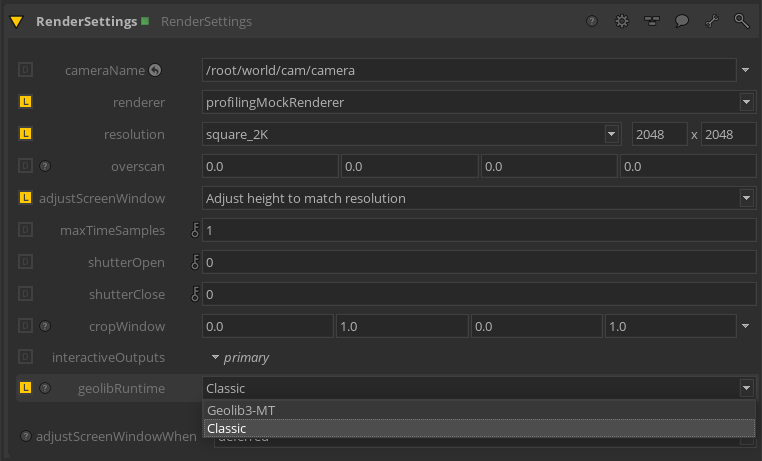
To enable the Classic Runtime, set the geolibRuntime parameter on a
RenderSettings node to Classic:
It is recommended to use an external concurrency solution when falling back to the Classic Runtime, allowing the Runtime to still take advantage of multithreaded scene traversal.