Changing the Display Range and Display Elements
Katana provides a number of ways to change the frame range and parameter value range in the Curve Editor graph.
|
Action |
Description |
|---|---|
|
Panning |
|
|
Panning in the graph |
Middle-click and drag within the graph area. |
|
Panning in a single axis |
Shift+middle-click and drag within the graph area. |
|
Zooming |
|
|
Zooming in or out |
Use the scroll wheel to scroll up (zoom in) and down (zoom out). Alternatively, press the + (Plus) key to zoom in or press the - (Minus) key to zoom out. |
|
Framing |
|
|
Framing all keyframes in the graph |
Right-click and select Frame > All > Frame All (or press A). |
|
Framing all keyframes in the graph in the X axis |
Right-click and select Frame > All > Frame All X Only. |
|
Framing all keyframes in the graph in the Y axis |
Right-click and select Frame > All > Frame All Y Only. |
|
Framing the selected keyframes |
Right-click and select Frame > Frame (or press F). Alternatively, right-click and select Frame > Selected > Frame Selected. |
|
Framing the selected keyframes in the X axis |
Right-click and select Frame > Selected > Frame Selected X Only. |
|
Framing the selected keyframes in the Y axis |
Right-click and select Frame > Selected > Frame Selected Y Only. |
You can display other information in conjunction with the parameter curves. Additional elements that can be displayed include: a domain slider to show the value on a curve for a given time; a curves velocity and acceleration; and a label to identify which curve corresponds to which parameter.
Displaying the Domain Slider
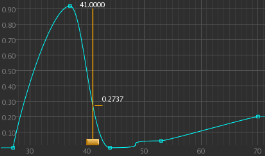
To toggle the display of the Domain Slider, right-click and select Show > Domain Slider (or press D). The Domain Slider, the orange vertical bar, can be moved left and right across the frame range to display the value for the highlighted curve at a particular frame.

Displaying a Velocity Curve
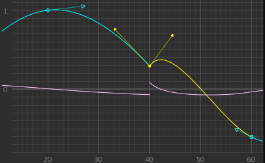
You can use a velocity curve for a parameter to help you spot non-tangential keyframes; these are characterized by breaks in the velocity curve. Non-tangential keyframes can be jarring when making realistic movement through animation. The velocity curve is calculated by analyzing the changes in the y axis of the curve at small increments along the x axis.

The purple velocity curve is broken (not continuous) at frame 40, as is the highlighted tangent.
To toggle the display of a curve’s velocity:
| 1. | Select the curve(s) within the hierarchical view. |
| 2. | Right-click an empty part of the graph and select Show > Velocity. |
The velocity curve is shown in lavender.
Displaying an Acceleration Curve
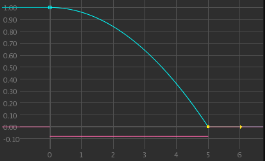
You can use the acceleration of a curve to provide a useful insight into the forces that act on that curve. For instance, an object whose only force is gravity should have a horizontal acceleration curve (assuming it doesn’t hit anything).

Between frames 0 and 5, the acceleration curve shows a consistent force is acting on the parameter (the acceleration curve is straight).
To toggle the display of a curve’s acceleration:
| 1. | Select the curve(s) within the hierarchical view. |
| 2. | Right-click anywhere on the graph and select Show > Acceleration. |
The acceleration curve is shown in pink.
Displaying Curve Labels
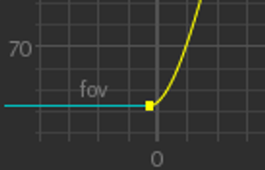
To toggle the display of curve labels, right-click and select Show > Heads Up Labels (or press H). The curve label, based on the parameter name, sits just above the curve on the left-hand side.

