Animation
Computer based animation owes its core concepts to the techniques employed by pencil-drawn animators since the dawn of the animation business. In order to reduce time, the lead animators of large studios would draw key poses - known as keyframes or keys - defining the extreme positions within a scene.
A different animator would then fill in the poses between the keyframes using a technique called tweening, thereby creating the illusion of movement. For some scenes, breakdowns were created to show how the transition from one keyframe flowed to the next. Katana does the animation heavy lifting by interpolating the values between keyframes. You can tell Katana how you want these in-between frames to be generated by specifying a segment function.
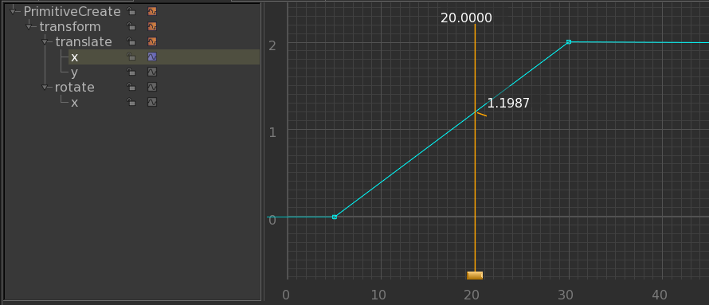
Two keyframes on frames zero and fifty with a linear segment function applied to the first. The most versatile segment function is the bezier curve; it uses a mathematical formula to calculate a curve between two anchor points. Bezier curves use four points to interpolate a curve: two anchor points (these are the keyframes) and two control points.
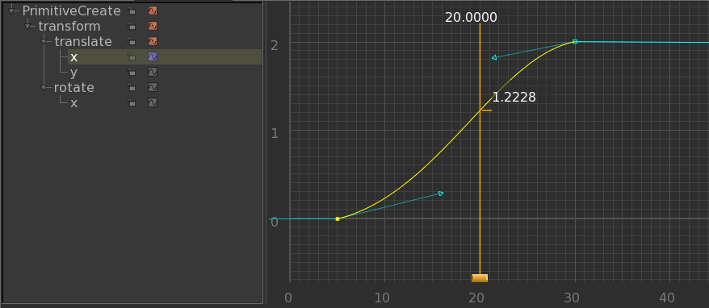
The same two keyframes with the bezier segment function applied. The arrowheads represent the location of the two control points. A tangent and its control points control the slope of the curve around the tangent’s keyframe.
|
|
|
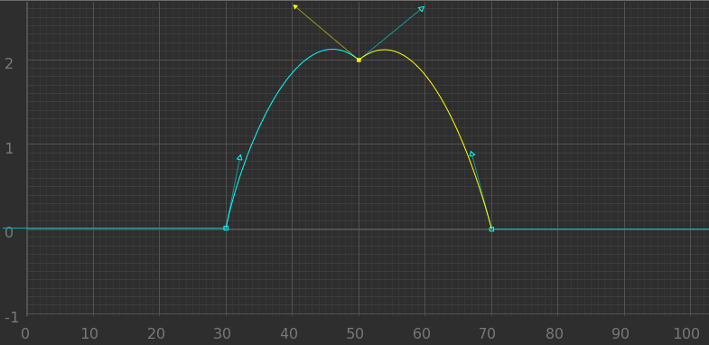
The selected control point handles, shown |
Here, a straight line between control points |
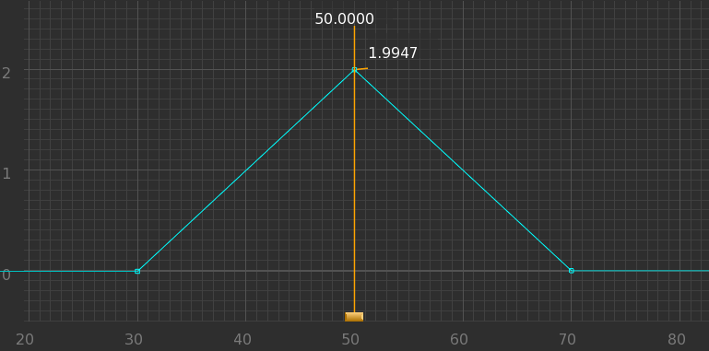
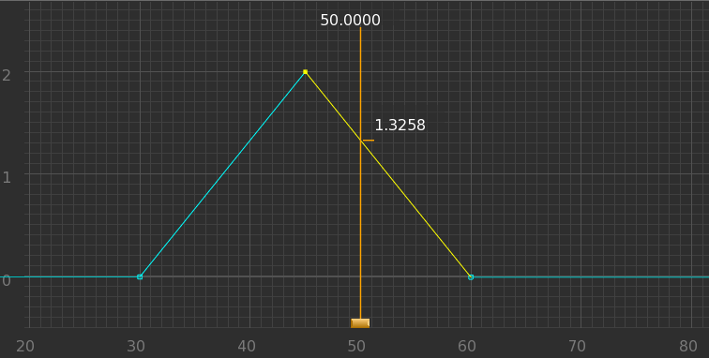
Breakdowns within the Curve Editor maintain the relative time between the keyframe before and the keyframe after.
|
|
|
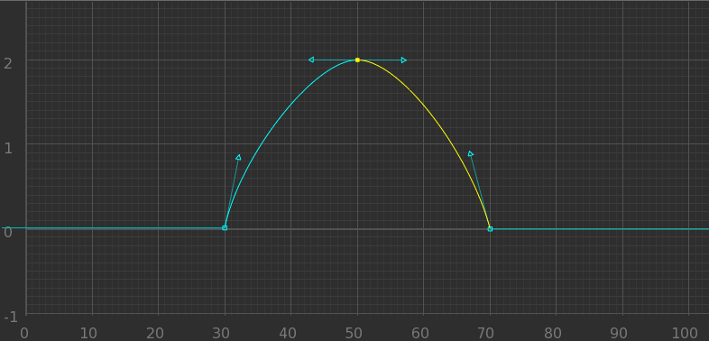
Keyframes have been placed on frames 30, |
Moving the third keyframe from frame 70 to |
Keyframes, breakdowns, segment functions, and tangents all combine to create a curve that represents how a value changes over time. A curve is plotted on a graph within the Curve Editor tab with time (in frames) along the x axis and the parameter’s value plotted on the y axis. When a parameter uses a curve, its background color within the Parameter tab changes to green. Light green signifies that the parameter has a keyframe at the current frame; a dark green parameter signifies that the value is interpolated.
|
|
|
|
A bright green parameter signifies a |
A dark green parameter signifies the value |

