Graph Editor
Animating in 3D, in some ways, can be very similar to the art of stop motion animation, where you build a model, place it in a scene, light the scene for atmosphere, and then animate the model to bring it to life. However, unlike stop motion animation, in 3D animation, you can easily skip multiple frames and lock in a fixed value, called a keyframe. Between those skipped frames the computer interpolates from one value to the other.
To open the Graph Editor, click Animate > Graph Editor. Alternatively, click Layouts > Palettes > Graph Editor.
The Graph Editor controls how the system interpolates those in-between key values.
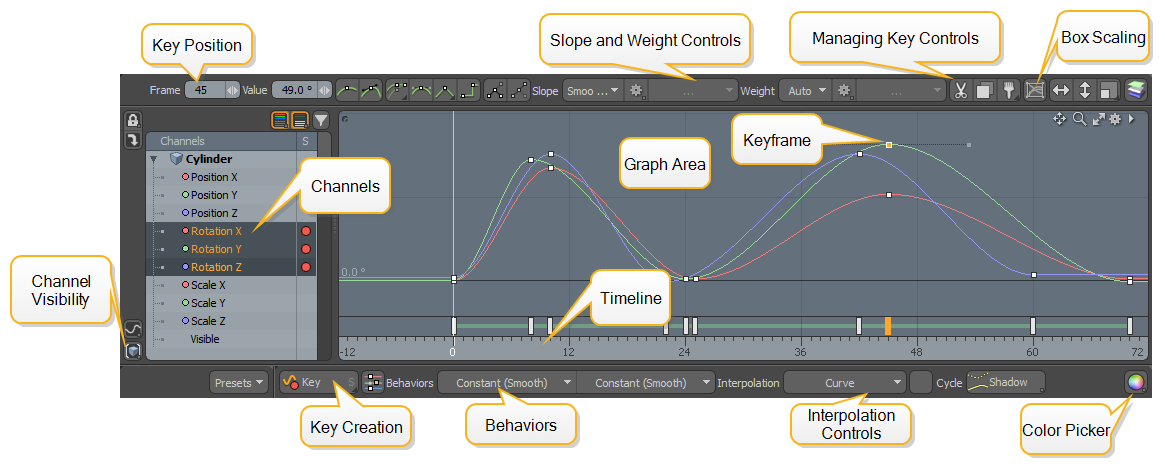
Nearly any property of any item can be animated by keyframing the values of an item's channel. Channels are the animateable properties of any item gathered together in list form. Generally, you interact with channels within the Channels Viewport, but since channels are so essential to the Graph Editor, the very same channels appear when an item is selected in the left-most column.
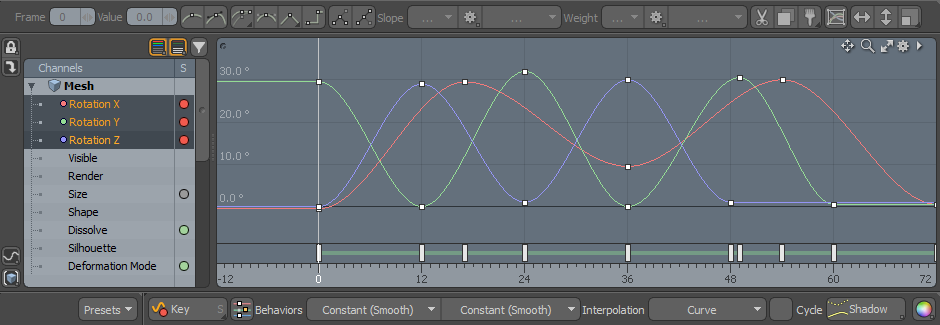
The graph area is where the actual values are manipulated. In this graph, left to right always represents time, but up and down changes depending on the channel type selected. The line that connects the individual keyframes represents the value's change over time. By default, Modo uses a smooth curve to interpolate between keyframe values, providing a nice ease-in/ease-out type of effect. There may be times when you want a very different interpolation style, or simply to apply finer control. Animation curves can only be changed by manipulating the keyframes and are very similar to working with Bezier curves in the modeling viewport. Keyframes are represented as tiny small squares along the line.
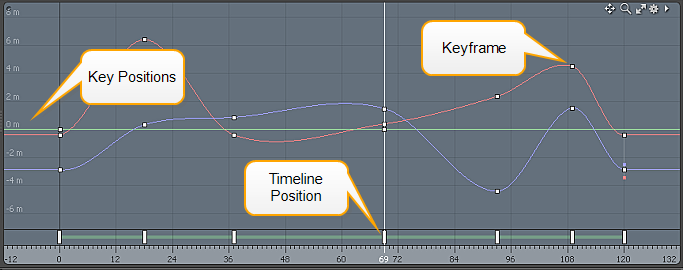
The Timeline across the bottom is functionally identical to the Timeline in the Animation layout. Clicking and dragging changes the current time. As you drag the current time value around, you can see the effect of the animation curve in the 3D viewport. Handles appear in the Timeline wherever a keyframe appears, and you can click and drag them in time forwards or backwards, modifying the position of the keyframes for selected channels.
Channels
When you open the Graph Editor, any selected items appear with their associated channels in the Channels section of the viewport. From this section, you can select the appropriate channel(s) you want to adjust. Only the selected channels appear in the graph area.
To select channels:
• On the left panel, click an individual Channel.
• Use the Ctrl and Shift keys to add or subtract additional Channels from selection groups.
• Hold Shift and click the top and bottom-most channels to select sequential channels.
When a particular channel is selected, its animation curve is displayed in the graph area. If no keyframes are defined, it appears as a flat dotted line. Once a keyframe is created, it appears solid.

Channel Visibility Properties
Along the left side of the viewport are toggle buttons that filter the visibility of the channels:
|
|
When enabled, only shows channels in the Channels view that have existing keys. |
|
|
When enabled, only shows channels in the Channels view that are part of the selected Groups Viewport. |
|
|
When enabled, shows transform channels for items. |
|
|
When enabled, shows standard item channels. |
|
|
When pressed, loads the currently-selected items into the Channels view, replacing the current contents. |
|
|
When enabled, locks the current items in the Graph Editor, so they remain, regardless of item selection, until disabled. |
Key Creation
Keys can be added to the currently-selected curve(s).
• Middle-clicking either on the curve itself or anywhere on the background.
• Alternatively, you can use the Ctrl+Alt+click shortcut to create keys.
Key values are created at the location of the pointer.
Tip: When working in the Graph Editor, dragging a key with the right mouse button constrains it horizontally so that only the time is adjusted.

The Frame and Value fields in the upper-left corner allow for precise editing of selected keys.
There are also two buttons for assigning keys that utilize the location of the Timeline within the graph.
|
|
Adds a keyframe to the selected channels at the current Timeline position. |
|
|
Adds a keyframe, same as the Key command, but retains the shape of the target curves by adjusting the Slope and Weight values along the target curve. |
Key Selection
To select a key(s):
• Click over the key itself.
• Hold the Shift key while selecting to add to the selection.
• Hold the Ctrl and click on a key to remove it from the selection.
• Click on the graph background to deselect all keys.
• Click-and-drag on the background starts "box marquis" selection - drag out a box to enclose the keys you want to select and release the mouse button. All keys within the box are selected and any outside the box are deselected.
Editing Keys
• Once you have added a keyframe to your curve, you can quickly add additional keyframes. Select the original keyframe to activate it, press Shift+Ctrl, and then drag it to a new position on the curve. Repeat this process to add additional keyframes. Once done, drop the Shift+Ctrl keys. As a result, new keyframes are added to the curve at the positions you specified.
• Click and drag on a key selects the key if it's not already selected and allows quick editing of both Input and Output values at the same time. If there are several keys already selected, and you click drag on one of them, then all the selected keys are modified.
• Middle-click and drag on a key works in a similar way except that editing is constrained to the Output value. Similarly, right-click and drag constrains the edits just to the Input value.
• Middle-click and dragging vertically on the background adjusts the Output value of all selected keys.
• Right-click and dragging horizontally on the background adjusts the Input value of all selected keys.
• Ctrl+middle-click and drag on the background provides constrained editing of Input and Output values for selected keys, based on the initial direction of movement.
• Double-clicking a key selects all the keys on the curve.
|
|
When Link related keys is enabled, associated keys (such as the R, G, and B color channels) remain at the same time interval, relative to each other, even if only a single channel key is modified; when disabled, keys can be freely moved. |
Inverting Keys
You can flip the horizontal and vertical positions of selected keys using either of the following two methods.
Key.invert Command
| 1. | Select two or more keyframes you want to invert by Shift+clicking on them. |

| 2. | In the Command line in the bottom-right corner, enter "key.invert", then press Enter. |

The positions of the selected keys are flipped.

Scale Keys
Another way of inverting keys is to use the Scale Keys ![]() button at the top of the Graph Editor.
button at the top of the Graph Editor.

| 1. | With the keys selected, click the Scale Keys |
This opens the Scale Keys dialog.
| 2. | Set Scale to -100.0% and Center Options to Center, then click OK. |

The positions of the selected keys are flipped.
Note: For more information on the Scale Keys options, see Managing Keys.
Scaling Multiple Keyframes
You can scale multiple selected keyframes by their frame numbers and keyed values using the Box Scaling Tool.
The following videos give you a quick overview of using the tool.
| 1. | On the right panel, in the Items list, select the mesh item you want to edit. |
| 2. | Press F7 to open the Graph Editor. |
| 3. | Hold Shift or Ctrl and click on individual keyframes to make a selection. |
Note: At least two keys with different input and output values must be selected.
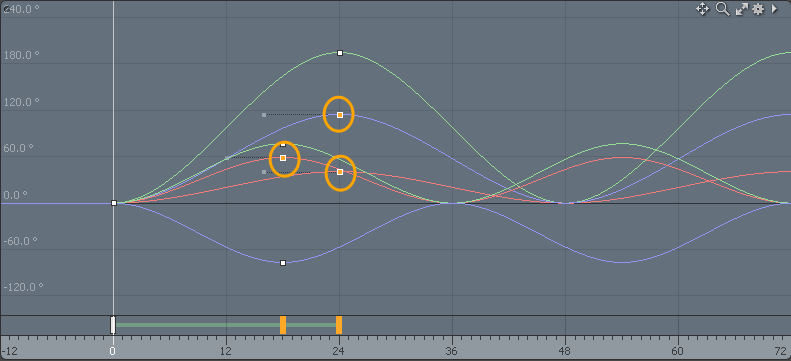
| 4. | On the top right corner of the interface, click the Box Scaling Tool |
A highlighted box displays around the selected keyframes on the graph.
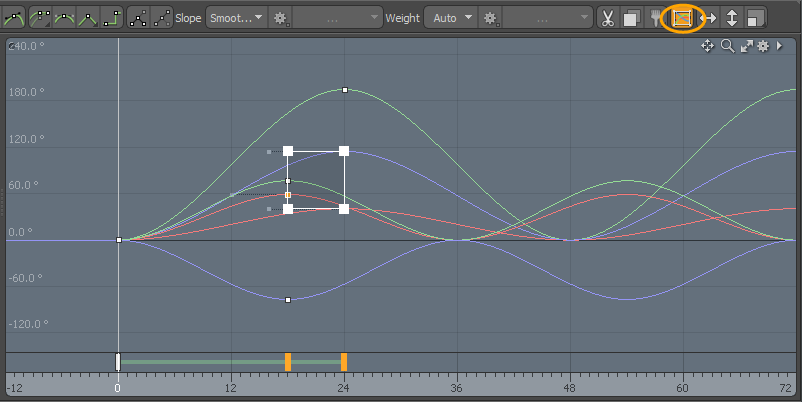
| 5. | Move or scale your keyframe selection by doing any of the following: |
• Move - Move your selection of keyframes.
• Click and drag in the middle of the highlight box to move all selected keys.
• Hold Shift and click and drag to constrain the selection movement up and down.
• Hold Ctrl/Cmd and click and drag to constrain the selection movement left and right.
• Scale - Scale your selection of keyframes.
• Click and drag from any of the sides of the box to scale all keys from the sides.
• Click and drag any of the corner points to scale your selections on the X and Y axis at the same time.
• Hold Ctrl/Cmd on one of the corner points and click-and-drag to scale and warp your selection from that point.

To reset the tool, click on the viewport outside the handle area.
Deleting Keys
Keys can be deleted from curves in two ways:
• To delete only the currently-selected keys, press Delete on your keyboard.
• To delete the currently-selected keys and keys at the same Input value on associated curves, select Delete Key(s) from the right-click context menu.
Saving Presets
You can save vector and scalar Envelope Presets for later use from the Graph Editor. Vector presets are a combination of multiple channels and contain direction information, while scalar presets are the values of a single channel.
To save a preset, select the channel to save and click the Presets button at the bottom of the viewport.
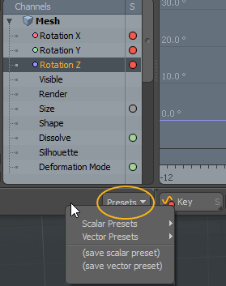
The preset is saved to the Preset Browser. Scalar presets are saved under Assets > Envelopes.
Note: The Envelopes folder is only created when you save your first Envelope Preset.
To apply a preset:
Select the channel to apply the preset to, then in the Graph Editor, click the Presets button, and click one of the available scalar or vector presets.
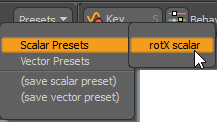
Alternatively, you can drag the preset from the Preset Browser and drop it onto the Graph Editor:
| 1. | On the top left corner of the interface, click the Open the Preset Browser icon. |
![]()
| 2. | On the left panel of the Preset Browser, expand Assets > Envelopes, then open the appropriate folder and click the preset you need. |
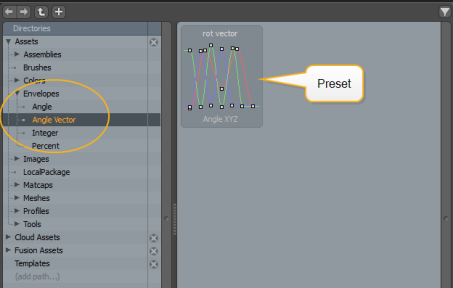
| 3. | Click-and-drag a saved preset onto the Graph Editor. |
The channel's value is added.
Context Menu
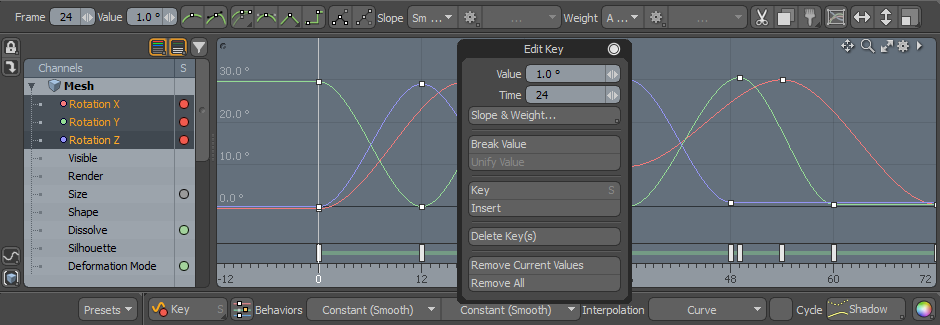
The Graph Editor context menu is accessed by right-clicking. If the cursor is over an un-selected key when the menu is opened the key is added to the selection. Operations performed from the Edit Key context menu affect all the currently selected keys.
Navigation
Panning and zooming behavior in the Graph Editor is similar to the 3D Viewports with a few additions:
• Alt+middle-click+drag adjusts the start value of the Input (horizontal) range displayed in the editor, while Alt+right-click+drag adjusts the end value of the Input range.
• Alt+Shift+middle-click zooms the Output range displayed in the editor, while Alt+Shift+right-click zooms the Input range. In both cases, the zoom is centered on the initial cursor location.
• Alt+Ctrl+right-click provides box zooming.
• Use the mouse wheel to zoom in and out at the cursor location.
Modifying Curves
There are a number of ways to control interpolation from one key to the next. This is represented by the curve/line that connects each key. By default, the values gradually fade from one to the next - this is the Auto setting. You can adjust the key settings so incoming and outgoing lines are smooth, linear, stepped, or a variety of other shapes. Small Bezier-like handles appear next to selected keys that allow you to make these adjustments. Clicking and dragging the handle modifies it, putting it in to the Manual mode.
The handles relate to the key in two ways, there is the angle of the handle called Slope, and then the length of the handle called Weight. These two options combine to produce the final shape of the curve.
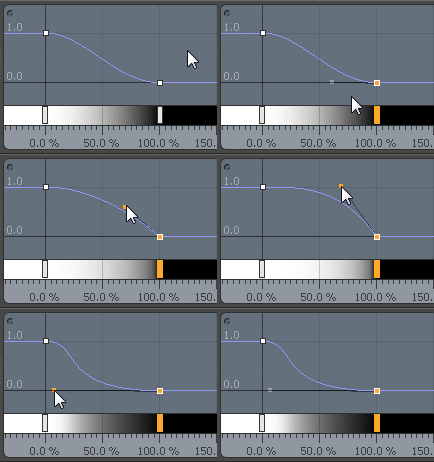
Use the following buttons to quickly set the most common Slope and Weight combinations.
|
|
Sets the selected keys to Auto for both slopes and weights. |
|
|
Sets the selected keys to Manual for both slopes and weights. |
|
|
Sets the selected keys to one of the following:
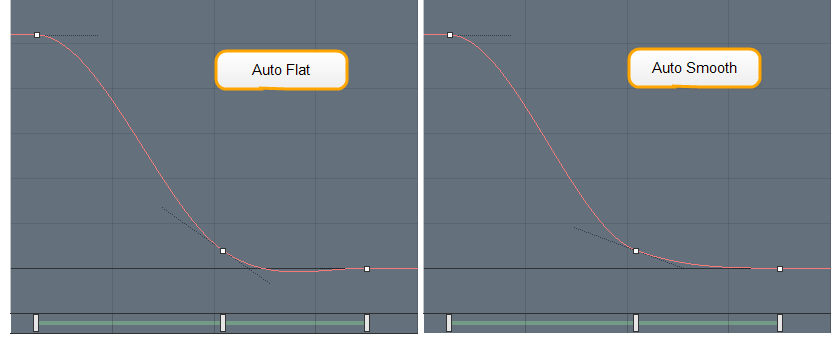
• Auto Flat - Sets selection to Auto flat slopes. • Smooth Flat - Adjusts the tangents as the key value approaches surrounding keys to avoid an over shoot. This is the default slope type for new keys. The Smooth Flat slope type also gives an improved Interpolation between keys. The image below shows a comparison with Auto Smooth and Auto Flat slope types in the background.
|
|
|
Sets the selected keys to Flat with Auto weights. |
|
|
Sets the selected keys to Linear with additional sub-menu options (right-click) for Linear In and Linear Out. |
|
|
Sets the selected keys to Stepped Slope with Auto Weight. |
The next group of buttons gives full control over both handles for each key - the incoming handle and the outgoing handle. You can think of the buttons representing the left side handle and the right side handle, where the setting is directed to each side, independent of the Slope and Weight. If the handle is unified, meaning adjusting one side moves the other in a straight line, then the outgoing settings are grayed out. The option gear in the middle allows you to "break" the handles or "unify" them, and to zero out the angle that makes them perfectly horizontal again. There are a number of settings under the pop-up menu when clicking any of the buttons.
Slope Controls
![]()
|
Manual |
Provides full control over Slope (handle angle). |
|
Auto |
Automatically adjusts Slope to produce a smooth ease-in and ease-out from the previous key value to the next. |
|
Linear In |
Angles the Incoming Slope to point toward the previous key, producing a straight line between keys. |
|
Linear Out |
Angles the Outgoing Slope to point toward the next key, producing a straight line between keys. |
|
Flat |
Sets the Slope to 0 degrees flat, regardless of the positions of the previous and next keys. |
|
Auto Flat |
Acts just like Auto except when the incoming or outgoing keys match the value, then it acts like Flat. |
|
Stepped |
Eliminates the Slope and Weight altogether, retaining the previous key value up until a new key is introduced. |
Weight Controls
|
Manual |
Provides full control over Weight (handle length). |
|
Auto |
Automatically adjusts Weight to produce a smooth ease-in and ease-out from the previous key value to the next. |
The following buttons also allow you to quickly break or unify the handles Slope and Weight in a single stroke. The color of the key itself represents the state of the two handles: unified handles draw as a white square while broken handles draw as a magenta square.
|
|
Breaks the key handles for adjusting Slope and Weight |
|
|
Unifies the handles for adjusting Slope and Weight. |
Managing Keys
The Graph Editor also offers useful functions for working with key values. Working with a clipboard buffer, you can move keys around and even move them from one channel to another. The Paste command simply adds the key values to the target, the Insert command adds them to the target and moves other keys as necessary, while Replace adds the keys, removing any existing keys it might overlap.
|
|
Cuts the selected keys from the editor and stores them in a temporary buffer for later access. |
|
|
Copies the selected keys from the editor and stores them in a temporary buffer for later access. |
|
|
Pastes the keys stored in the buffer. |
The following buttons open dialog boxes that allow for easy gang editing of multiple selected values.
|
|
Opens the Set Frame dialog panel for adjusting the time position (not directly applicable to gradients).
• Time - Determines the position in time to move the selected keys to. • Absolute - When enabled, Absolute time is used, where a specific time can be defined; when disabled, the time is relative to the current time position. • Linked - When enabled Linked keys (such as those of the R, G, and B channels) remain linked in the same relative position, even if only a single channel is edited; when disabled, keys can be moved freely. • Ripple - When enabled, all the following values of those selected are shifted by the same amount. |
|
|
Opens the Set Key Value dialog panel for adjusting the value of the selected keys.
• Value - Defines the new value that is applied to the selected keys when the mode is set as Set; defines what value is added when mode is set to Add. • Multiple by - Acts as a multiplier of the selected values when mode is set to Multiply. • Mode - Determines how the values affect the selected keys: Set, Add, and Multiply. |
|
|
Opens the Scale Keys dialog panel for scaling the value of the selected keys.
• Scale - Defines the amount of scaling applied to the selected keys. • Center Options - Determines the center location to scale the keys from- Start, Center, End, Time, and User. When Time or User is selected, the Center Value can be used to define the specific center. • Center Value - Determines the specific center locations when the Time or User options are selected as the Center Option. • Mode - Provides two modes to determine which direction gets scaled: Input scales the interval (horizontal) while Output scales the value (vertical). • Link - When enabled, linked keys (such as those of the R, G, and B channels) remain linked in the same relative position, even if only a single channel is edited; when disabled, keys can be moved freely. |
Behaviors
The Behavior buttons define the incoming and outgoing curves that are outside the area of defined keys. The left button defines the per-behavior and the right button the post-behavior.
![]()
|
Constant |
Values remain the same. With the AutoSlope and Weight options, ease-in or out as it transitions to the key values. |
|
Constant (Smooth) |
Same as Constant, but the keyframe slope values are adjusted to smoothly transition to the Constant behavior. |
|
Linear |
Values project outward in a linear fashion from the first or last key, providing a constant offset. |
|
Repeat |
Values of keys are repeated. When incoming and outgoing values match, a loop can be created. |
|
Oscillate |
Values are repeated forwards, and then reversed, like a ping-pong type effect. |
|
Oscillate (Smooth) |
Same as Oscillate but slope V values are adjusted to smoothly transition to the next oscillation. |
|
Offset Repeat |
Values of keys are repeated, but each subsequent repeat is offset by the amount of the last key. |
|
Offset Repeat (Smooth) |
Same as Offset Repeat but slope values are adjusted to smoothly transition to the repeated sections. |
| Reset |
Values are set to flat 0 (zero) outside the key area. |
Interpolation
Interpolation controls the way in which all values are calculated between user-defined keyframes and can be a useful shortcut to modifying all the Slope and Weight values automatically for all keys.

Interpolation Options:
• Curve - Allows you to smoothly control the easing-in and -out of the values. This is the default.
• Linear- Draws a straight line to each key that produces a jarring, mechanical kind of transition to the keys.
• Stepped- Stair-steps the values from one key to the next. This can be useful to see specific key positions or poses for a character without the distraction of the in-between frames.
![]()
When the Cycle option is enabled, the last keyframe is aligned to match the value of the first keyframe. The original value of the last key is shown as a colored square with a line connecting it to its new value. The last keyframe in the sequence defines the cycle length. The slope and weight values of the last keyframe are also adjusted to match, so the incoming and outgoing curves flow smoothly together. The first key's handle can be broken to allow the slope and weight values to be changed independently.
Shadow

The Shadow function works to save alternate versions of a key graph for all currently-selected channels, allowing for convenient and non-destructive editing of the curves. Selecting the Copy to Shadow option adds them into a faded background view where you can then continue to adjust the keys visually, and see the current changes relative to the previous shadow values. You can then adjust keys, and scrub or play the Timeline to see the results. Pressing the Shadow button opens the pop-up menu with the following option:
|
Copy to Shadow |
Stores the currently-selected channels into the shadow. Shadow channels are saved with the scene and are persistent across Modo sessions for the assigned channels. |
|
Replace with Shadow |
Completely replaces the current channel values with the stored shadow values. |
|
Swap |
As the name implies, the current values are replaced with the shadow values, and the shadow values are replaced with the current graph values. |
|
Clear Shadow |
Deletes the shadow data from the selected channels. |
Animation Curve Views
There are multiple curve options you can use to optimize your way of working with animation curves. Adding Velocity and Speed curves for specific channels can help you visualize a specific channel's values, while normalized and stacked curves can make keyframe editing easier.
You can find the controls at the bottom of the Graph Editor.

Velocity Curves
Velocity curves represent the selected channel's change in value over time, helping you visualize and smooth out the movement of animated items. You can display a Velocity curve for a single floating point type channel.
To work with Velocity curves:
| 1. | Select a single channel from the list on the left. |
| 2. | Click the Velocity Curves |
A blue Velocity Curve appears in the editor. The image below shows the Velocity curve for the selected Position X channel.

Speed Curves
Speed curves are similar to Velocity curves, but they are only drawn when one or more Position channels are selected. They represent the distance the item moves over time.
Note: Speed curves refer to the local space of the item the channels belong to. It does not represent the world speed of the item in the scene if the item is parented to another moving item, has modifiers applied, or the item has other Position transform items.
To enable Speed curves:
| 1. | Select one or more Position channels from the list on the left. |
| 2. | Click the Speed Curves |
A purple Speed Curve appears in the editor. The image below shows the Speed curve for the selected Position X and Position Y channels.

Normalized Curves
When multiple channels are selected in the Graph Editor, the view is scaled to fit the curves. When there is a significant difference in the ranges that these curves are animated over, they can become flattened vertically in the viewport, making editing more difficult and the animation harder to visualize.
Normalized curves allow each of the selected channels to be drawn in the same view space, each being scaled to a common vertical range. This makes editing and visualizing the curves easier.
|
|
|
Regular view |
|
|
|
Normalized view |
Note: In this mode the vertical ruler on the left of the Graph Editor is not drawn, since each curve has it's own range.
To enable or disable Normalized curves, click the Normalized Curves ![]() button in the lower-right of the Graph Editor.
button in the lower-right of the Graph Editor.
By default, curves are normalized when selected and keep their scaling during editing. The Normalized Curves ![]() button rescales selected curves to fit the normalized range.
button rescales selected curves to fit the normalized range.
Note: Middle-clicking on the background to add keys is disabled when multiple normalized curves are displayed. You can still middle-click a specific curve to insert a key.
Stacked Curves
Stacked curves are similar to Normalized curves, but each channel is drawn individually in selection order from top to bottom.
To enable or disable Stacked curves, click the Stacked Curves ![]() button in the lower-right of the Graph Editor.
button in the lower-right of the Graph Editor.
When enabled, the view automatically fits to a maximum of six channels, and further channels are drawn below. You can pan and zoom the viewport to look at these channels.
You can adjust the spacing between the rows by holding Ctrl and scrolling with the mouse wheel.

The spacing is reset when no channels are selected.
To step through the stacked rows, hold Shift and scroll the mouse wheel.


