Debug Views
You can view debug information from each RenderNode. This information can be useful while setting up and playing back your project.
There is an overlay UI for this debug information that can be controlled directly on each RenderNode. Alternatively, access it in the Nuke Stage Editor from the Render Debug Panel. Full controls can be found at Render Debug Controls.
Note: Future builds will show more of this information in the Editor as this product is developed. Some of these views are technical - if you are continuing to encounter errors, you can contact support.
Tip: You can hide or show the render debug menu bar and debug view by using the keyboard shortcut F1 in the RenderNode application. Alternatively, in Nuke Stage Editor go to the Render Debug panel (found in the Setup workspace by default) and tick/untick Visible.
Below is a description of the tabs in the Debug Views.
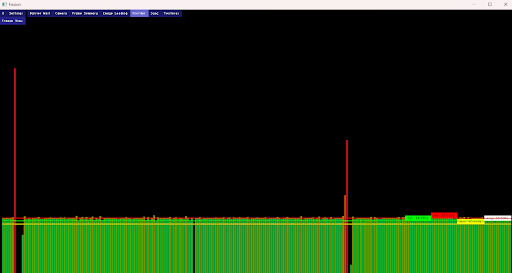
Profiler
This tab displays a flamegraph for RenderNode performance. Individual frames can be selected to give more information on where the RenderNode is spending time.
This is a useful view that can tell you if each RenderNode is consistently hitting its target speed, and if not where the time is being spent.
Note: The Network Panel Controls in the Nuke Stage Editor gives a rough estimate of the slowest recent frametime, so you don't always have to use the Profiler to get this information.
Each green bar is the overall time spent on a given frame (in hertz, measured on the y axis). The color of the bar ranges from green (close to target time) to red (far from target time). A black bar cycles through these bars indicating the current frame.
The four horizontal lines correspond to the targets set in the project.
-
Green - the target based on your project framerate.
-
Red - longest framerate.
-
Yellow - shortest framerate.
-
White - average framerate.
Note: The profiler auto-freezes when a frame is selected, and will continue to be frozen until you click the button to unfreeze the overlay.
Tip: To stop the overlay from updating, press Space or click the button at the top of the view. You can then investigate a particular frame.
Sync
Displays a configurable strobe or line pattern, which can be used as a visual guide as to whether machines are syncing.
In synced RenderNode setups, when using the strobe, the strobe color should always match across RenderNodes. You can pause the effect so you can check whether the effects are matching.
When using the line pattern, the lines work in output space, meaning they will wrap around the edge of the output window you're displaying on the RenderNode. This means that if your wall mapping does not cover the full window (or is chopped up), the lines will not display as continuous on the wall, as they will cut off at the boundaries of your wall mapping.
This is the quickest way to ensure a multi-RenderNode setup is synced. The strobe/line color and speed can be customized.
You can also define whether to display a timecode on the RenderNode in the overlay toolbar.
Warning: The strobe feature content contains imagery with flashing lights and strobe effects that may trigger seizures or cause discomfort in individuals with photo-sensitivity. User discretion is advised.
Strobe pattern:
Line pattern:
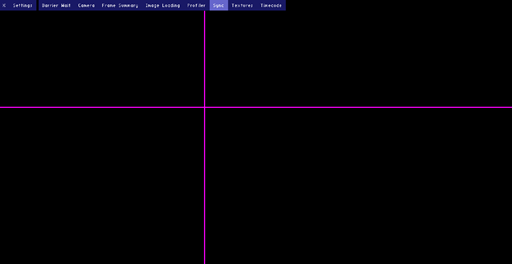
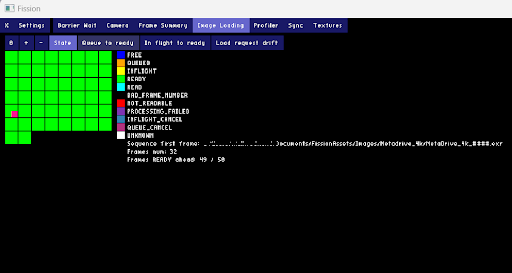
Image Loading
Provides some detailed visualizations on the performance of image loading. The overlay toolbar will display different views of this performance. Each tile represents a frame in the sequence, and the color indicates the state of the frame depending on the view.
The Throughput displays how many frames are being loaded at one time. The Safety option displays how many frames are loaded ahead of being displayed.
Request State View
Queued: The RenderNode has begun the process of requesting the frame.
Preparing: The RenderNode is preparing to request data from storage.
In-flight: The RenderNode has sent a request to storage for the data.
Finished: The RenderNode has received the data from storage.
Cancelled: The RenderNode stopped processing the request before completion. Usually, this is due to the frame not making it back from storage in time for presentation.
Errored: The RenderNode stopped processing the request not because it ran out of time, but because something blocked it's progression.
Additional Overlay Toolbar views
The additional Toolbar options (Requested to queued, Requested to in-flight, Requested to finished, Queued to in-flight, Queued to finished, In-flight to finished) indicate how long each step took (red is slow, green is fast).
This is an advanced view, but it can be helpful to get detailed performance stats when general playback performance on a RenderNode is poor.
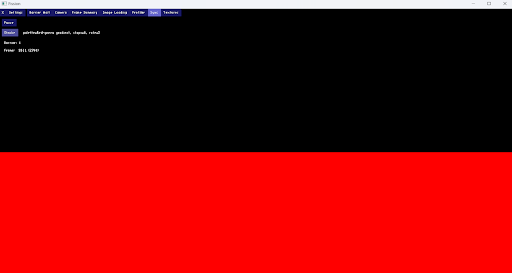
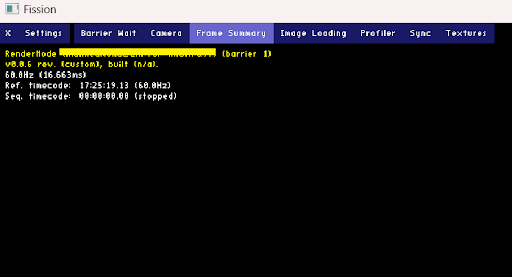
Frame Summary
Provides a high level summary of the frame, including framerate and timecode, as well as connection information.
Most high level information for each RenderNode is available in the network panel in the Nuke Stage Editor, but it may be useful to occasionally double check data here.
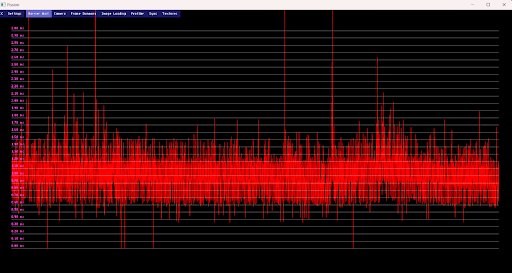
Barrier Wait
This graph details the amount of time spent waiting on the sync barrier every frame. The x axis of this graph is frames, and the y axis is length of time (in milliseconds) spent within that frame.
This is an advanced view which indicates how long the RenderNode process waited for the relay to signal it to start rendering the frame.
If the graph grows constantly or has large spikes it might indicate performance and/or sync issues.
You can also use the Sync barrier and Yield-to-await parameters in the Editor’s Network panel to gain similar information. The Sync Barrier value is the same value that is displayed in this debug view.
Timecode
A graph view to detect whether there are any timecode issues with your playback. The x axis is the wall clock time, and the y axis is the timecode time.
The green line represents an ideal target, and the red line is the timecode data of the project. The red line has vertical white lines along it, which indicate when the timecode is sampled.
When the red and green lines are close to parallel to each other, and the red line has a constant gradient, the timecode is functioning properly.
If you have a horizontal step on the red line, it could indicate that there are timecode issues. Alternatively, a big gap between the white lines means there is a performance issue with your playback.
Note: It takes a few seconds for this view to become steady and trustworthy.
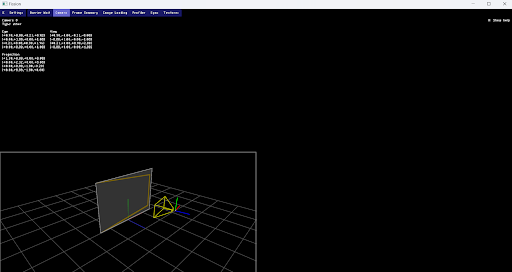
Camera
Shows a 3D view of the camera and display that the RenderNode is outputting to.
A live camera view is also available in the Nuke Stage Editor but this view can be useful for ensuring the tracking data is being received correctly by particular RenderNodes.
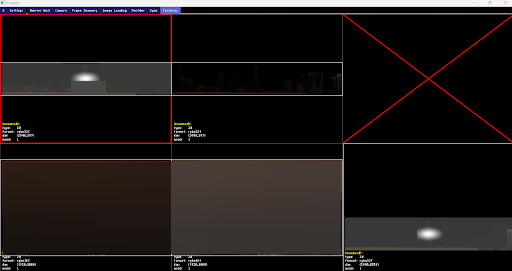
Textures
A view of all textures being processed by a RenderNode. Information such as type, format and dimension can be found on each texture window.
The texture's visualization and dimensions are also viewable in the Nuke Stage Editor image viewer, but it can be useful to ensure each RenderNode is also processing the images correctly. Missing content here may indicate missing assets on a RenderNode machine.