Using Performance Timing
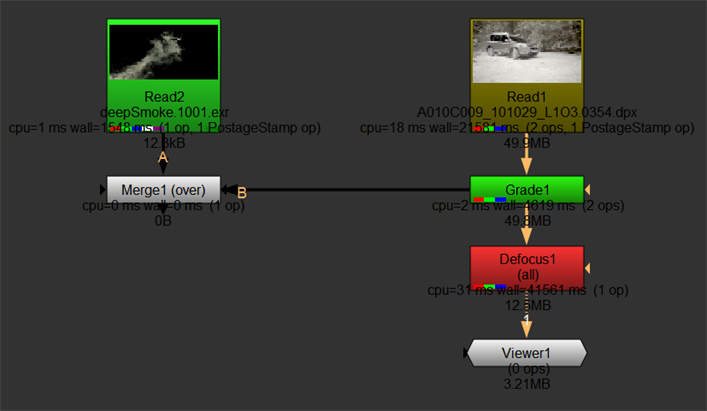
Nuke can display accurate performance timing data onscreen or output it to XML file to help you troubleshoot bottlenecks in slow scripts. When performance timing is enabled, timing information is displayed in the Node Graph, and the nodes themselves are colored according to the proportion of the total processing time spent in each one, from green (fast nodes) through to red (slow nodes).
Note: You can also access timing information for individual nodes using Python. See https://learn.foundry.com/nuke/developers/113/pythondevguide/performance.html for more information.
Enabling Performance Timings
You can enable profiling from the Script Editor or from the command line using the -P argument. You can also output the timing data to an XML file by adding the -Pf argument and a file name, though the output is only produced at render time.
Note: Enabling performance timings interactively or from the command line adds an extra processing overhead, but the data still provides an accurate picture of where processing time is spent in the script.
Outputting Performance Timings Onscreen
Enabling performance timings onscreen allows you to view cumulative data, as you work, on a per node basis.
From the Script Editor, enter:
nuke.startPerformanceTimers()
From the command line, enter:
./Nuke<version>/Nuke<version>.exe -P
Note: You can reset the timing data using nuke.resetPerformanceTimers() from the Script Editor.
When the performance timers are active, the following information is available onscreen:
• cpu - the time that the CPU spent executing the processing code, in microseconds, aggregated over all CPU threads. For example, with multi-threaded processing this is typically much larger than the wall time. If the average CPU time per thread (cpu divided by the number of threads used) is much shorter than the wall time, this suggests the CPU threads have spent a lot of time not executing code and perhaps waiting on locks, which could indicate a performance problem.
Note: On Mac and Windows, the CPU time is not currently accurate. On Mac, the cpu value is always similar to the wall time.
• wall - the time taken as it would be measured by a clock on the wall - the actual time you have to wait for the processing to complete. The wall time is also measured in microseconds.
• ops - the number of operators called in the node. Operators are Nuke's building blocks that perform certain tasks. Nodes can contain one or more ops. For example, when a node needs to resize something it would use a Transform op rather than an implementation of its own to do the same thing.
See https://learn.foundry.com/nuke/developers/113/ndkdevguide/intro/terminology.html#op for more information.
• memory - the total amount of system memory used by the node.
In addition to the timing information, nodes are color-coded according to their profiling, green through red, where red is a slow node. You can see from the example script that Defocus is a slow node, whereas Merge is doing no work at all.
Note: You can stop displaying timing data using nuke.stopPerformanceTimers() in the Script Editor.
Writing Performance Timings to File
You can output the timing data to an XML file using the -Pf argument and a file name. The output is only produced at render time, either from a Write node or from a command line render.
On Windows, for example, the following command writes profile data to file when you render from a Write node in the Node Graph:
Nuke<version>\Nuke<version>.exe -Pf <file path and name>.xml
Rendering from the command line, the following command renders 10 frames from a script called profileTest.nk and writes the profile data to an XML file:
Nuke<version>\Nuke<version>.exe -x -Pf C:\temp\profileTest.xml C:\temp\profileTest.nk 1-10