Modifying Objects Using Lookup Curves
The CrosstalkGeo and LookupGeo nodes offer you direct global control over each of the vertex x, y, and z values respectively. You can, for example, only modify all the y values without touching the x and z values.
You change the different vertex values (x, y, or z) by modifying their associated 2D curves in lookup tables (LUTs). The x axis in the LUT represents the current vertex value, and the y axis the new vertex value.
By default, the curve is a diagonal line where all the points in the curve have the same value on the y axis (the new value) as they do on the x axis (the current value). Because both x and y values are the same, there is no change in the object’s shape.
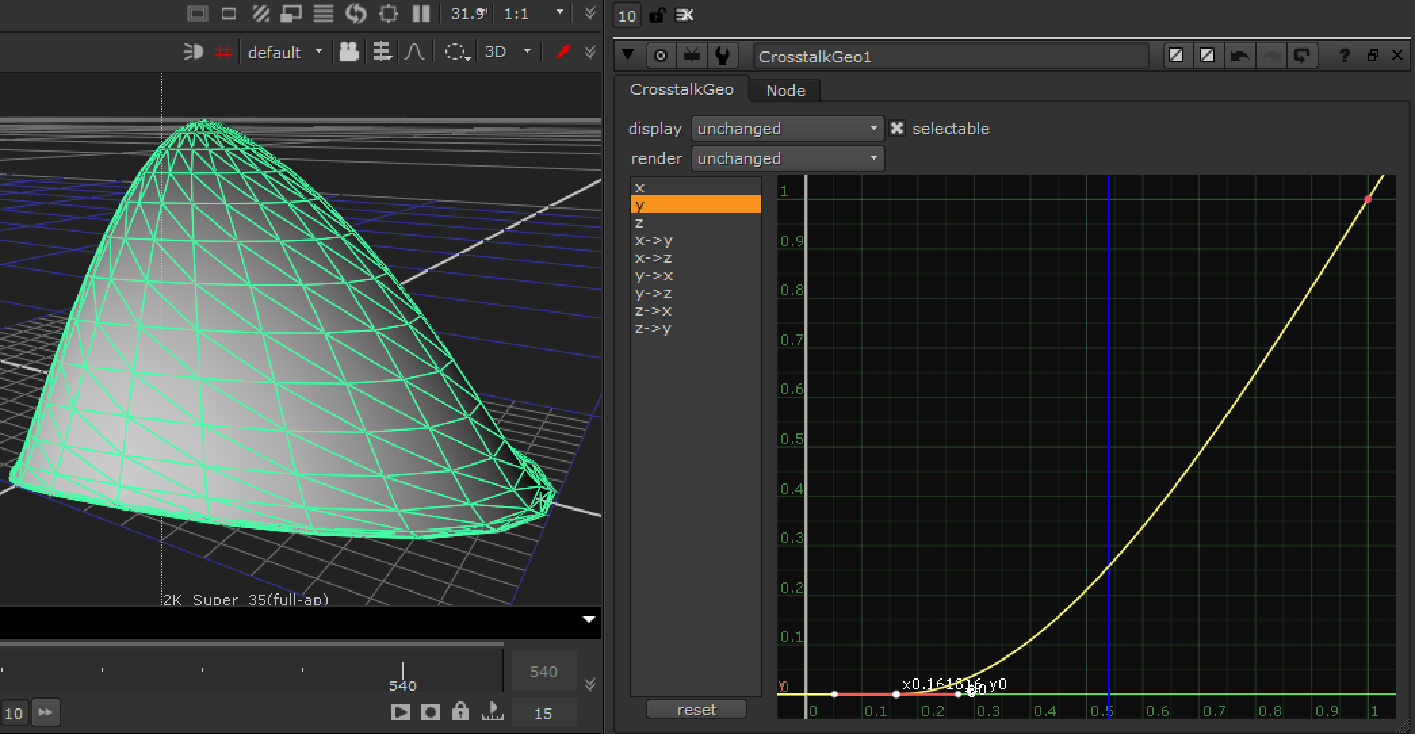
By modifying, for example, the CrosstalkGeo node’s y LUT the following way, you can set some of the vertex y values of a sphere to 0 to squash its bottom half:
|
|
|
Modifying the CrosstalkGeo node’s LUT. |
With the CrosstalkGeo node, you can also use one of the vertex x, y, and z values to evaluate the lookup curve and then add the result to another vertex value. For example, you could modify the x->y curve, using the vertex x value to find the new value on the curve, and then add that to the vertex y value. This way, you can modulate the y values by another channel.
By default, these curves are horizontal lines at y=0. They produce no change, because the value added to the vertex (the new value on the y axis) is 0.
To Modify Objects Using Lookup Curves
| 1. | Select 3D > Modify > CrosstalkGeo or LookupGeo to insert a CrosstalkGeo or LookupGeo node anywhere after the 3D object you want to modify. |
| 2. | Attach a Viewer to the node to see your changes. |
| 3. | In the node’s controls, use the display dropdown menu to select how you want to view your object in the Viewer while making changes to it. |
| 4. | From the list on the left, select the curve you want to modify. For example, you’d select z to only modify the vertex z values. |
In the case of the CrosstalkGeo node, you can also select y->x, for example, to use the vertex y value to evaluate the curve and add the result to the vertex x value.
| 5. | Adjust the curve as necessary. To insert points on the curve, Ctrl/Cmd+Alt+click on the curve. |