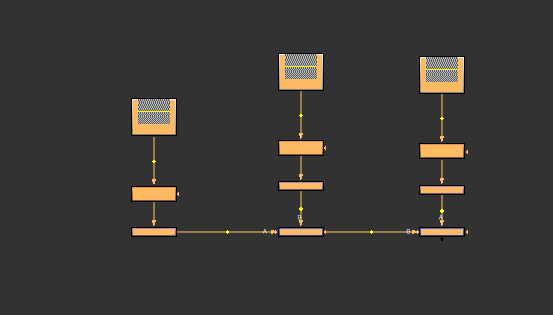
Manipulating the Node Graph
You can use Python to:
- get and set node properties that define the node’s position in the Node Graph (sometimes called the DAG)
- control the Node Graph’s zoom and pan values.
There is a video tutorial about manipulating the Node Graph on Nukepedia.
Getting and Setting Node Positions
You can access a node’s x and y position in the Node Graph via its knobs:
node = nuke.createNode( 'NoOp' )
print node['xpos'].value()
Use the usual knob method to set a new position:
node['xpos'].setValue( 100 )
print 'new position is', node['xpos'].value()
For convenience, there are also methods to set and get node positions:
node.setXpos( 111 )
node.setYpos( 222 )

xPos = node.xpos()
yPos = node.ypos()
print 'new x position is', xPos
print 'new y position is', yPos
To set both x and y value at once:
node.setXYpos( 123, 234 )
To get a node’s width and height in pixels at zoom level 1:
nodeWidth = node.screenWidth()
nodeHeight = node.screenHeight()

print "Node dimensions are %s x %s" % ( nodeWidth, nodeHeight )
To arrange nodes in a neat tree formation so they don’t overlap, use node.autoplace():
for n in nuke.allNodes():
    n.autoplace()
To snap nodes to the nearest grid position:
for n in nuke.allNodes():
    nuke.autoplaceSnap( n )
Controlling the Node Graph’s Pan and Zoom
To pan and zoom the Node Graph, use nuke.zoom().
When called without any arguments, this simply returns the current zoom level:
nuke.zoom()
With an argument larger than 0, the Node Graph zooms to the given level. For example, to reset the view to 1:1, use:
nuke.zoom(1)
You can also specify the center of the zoom operation. To zoom into the selected node, use:
node = nuke.selectedNode()
nuke.zoom( 3, [ node.xpos(), node.ypos() ])
The above example actually zooms into the node’s upper left corner. Let’s zoom into the center of the node instead:
node = nuke.selectedNode()
xC = node.xpos() + node.screenWidth()/2
yC = node.ypos() + node.screenHeight()/2
nuke.zoom( 3, [ xC, yC ])
Examples
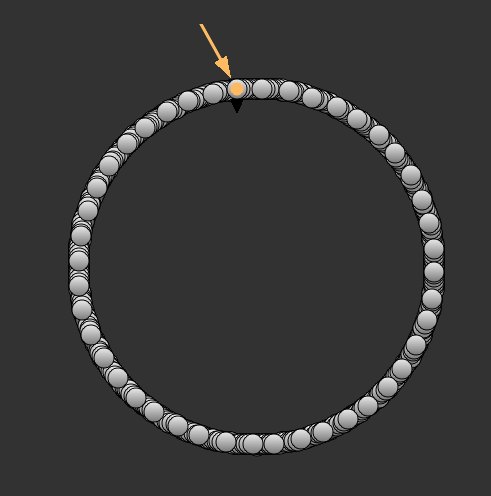
A Circle Made of Dot Nodes
import math
for x in xrange(1000):
    n = nuke.nodes.Dot( xpos = math.sin(x)*100, ypos = math.cos(x)*100)
    n['hide_input'].setValue(True)
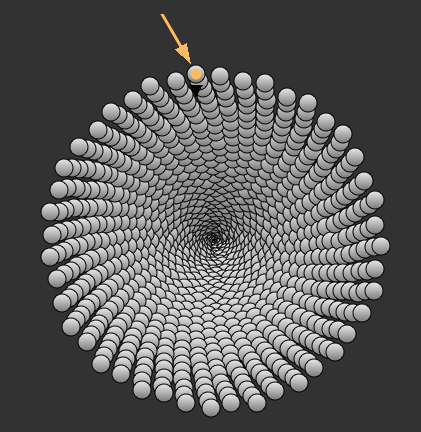
A Spiral
import math
for x in xrange(1000):
    n = nuke.nodes.Dot( xpos = math.sin(x)*x/10, ypos = math.cos(x)*x/10)
    n['hide_input'].setValue(True)
Controlling the Distance between Nodes
import nuke
def scaleNodes( scale ):
    nodes = nuke.selectedNodes()    # GET SELECTED NODES
    amount = len( nodes )    # GET NUMBER OF SELECTED NODES
    if amount == 0:    return # DO NOTHING IF NO NODES WERE SELECTED

    allX = sum( [ n.xpos()+n.screenWidth()/2 for n in nodes ] )  # SUM OF ALL X VALUES
    allY = sum( [ n.ypos()+n.screenHeight()/2 for n in nodes ] ) # SUM OF ALL Y VALUES

    # CENTER OF SELECTED NODES
    centreX = allX / amount
    centreY = allY / amount

    # REASSIGN NODE POSITIONS AS A FACTOR OF THEIR DISTANCE TO THE SELECTION CENTER
    for n in nodes:
        n.setXpos( centreX + ( n.xpos() - centreX ) * scale )
        n.setYpos( centreY + ( n.ypos() - centreY ) * scale )
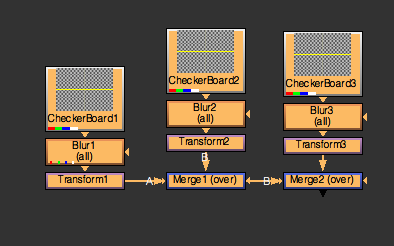
scaleNodes( 3 )
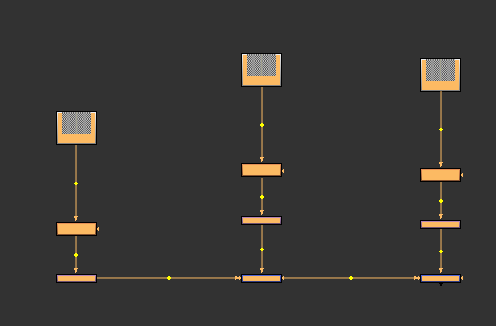
scaleNodes( .7 )
