O_DisparityGenerator Example
In this example, we read in a stereo image, use O_DisparityGenerator to calculate its disparity map, review the results using DisparityReviewGizmo, and render the result as a single .exr file that contains the left and the right view and the newly created disparity channels. Later, whenever you use the same image, the disparity map is loaded into Nuke together with the image. This makes the disparity map readily available for the other Ocula nodes, many of which need it to produce their output.
The stereo image used in this example can be downloaded from here.
Step by Step
| 1. | Start Nuke and press S on the Node Graph to open the project settings. Go to the Views tab and click the Set up views for stereo button. |
| 2. | Select Image > Read to import Dance_Group.exr. The .exr format allows both views to exist in a single file, so Nuke reads in both the left and the right view using the same Read node. |
| 3. | Select Ocula > Ocula 4.0 > O_DisparityGenerator to insert an O_DisparityGenerator node. |
|
|
|
The node tree with O_DisparityGenerator. |
| 4. | Display one of the disparity channels by selecting it from the channel set and channel menus in the upper-left corner of the Viewer. |
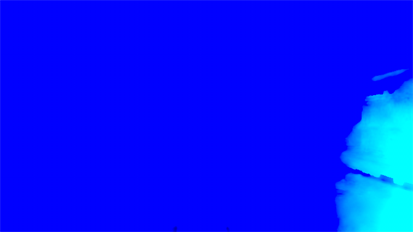
O_DisparityGenerator calculates the disparity map. You will probably see something colorful and seemingly unreadable, much like the image below. Don’t worry - that’s what the disparity channels are supposed to look like.
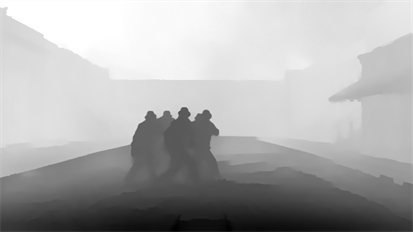
Reading depth in disparity maps can be tricky in RGB. There are a number of ways to make the depth easier to read, but the simplest is to adjust the Viewer controls to display the results:
• Set the Viewer channels control to disparityL and the R layer within the channel.
• Move the pointer around the image to locate the highest negative red value using the Viewer info bar.
• Set the Viewer gain numeric field to -1/<red value>, such as -1/40.
• Adjust the Viewer gain and gamma controls to reveal edges and areas of contrast. Darker areas of the image are closer to the camera and lighter areas farther away.
|
|
|
|
The calculated RGB disparity map. |
The same map, but with the Viewer adjusted. |
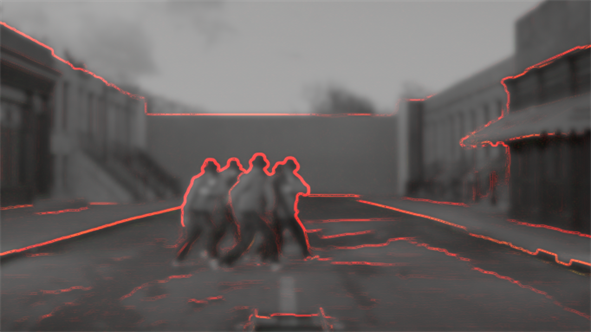
Ocula also ships with a disparity checking gizmo, called DisparityReviewGizmo, to help you check that your disparity calculations are correct before you pass the data down the Node Graph.
| 5. | Select Ocula > Ocula 4.0 > DisparityReviewGizmo to insert the gizmo after the O_DisparityGenerator node. |
Note: To use the gizmo's full toolset, you'll also need an occlusion map. See OcclusionDetector for more information on how to generate occlusion maps.
| 6. | The gizmo's default settings display your stereo source image, desaturated so that the overlay generated by the gizmo is easily visible. Disparity on the X and Y axes are displayed in red and green, respectively, and occlusions are displayed in blue (if you've generated an occlusion map). |

In our example, we haven't added occlusion data (blue) and there isn't any appreciable Y axis displacement (green). The red overlay is generally picking out the changes in depth pretty well.
| 7. | Select Image > Write to insert a Write node between the O_DisparityGenerator and the Viewer. |
| 8. | In the Write node controls, select all from the channels menu to include the disparity channels in the rendered file. |
| 9. | In the file field, enter a file name and location for the new .exr file. Make sure file type is set to exr. Then, click the Render button to render the image as usual. |
| 10. | Import the .exr file you created. Using the Viewer controls, check that it contains the left and the right view and the disparity channels. |
You can now use the .exr file you created together with many of the other Ocula nodes without having to insert an O_DisparityGenerator node before them.


