Search is based on keyword.
Ex: "Procedures"
Do not search with natural language
Ex: "How do I write a new procedure?"
Geolib3-MT Profiling
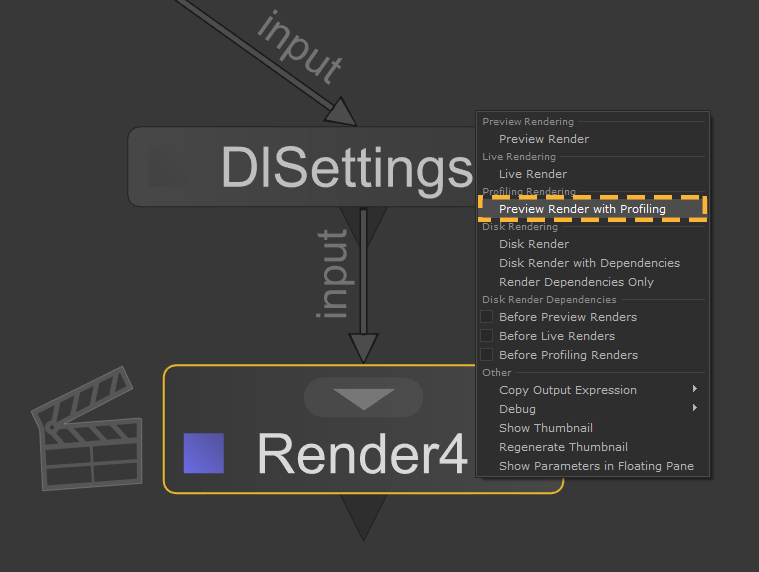
Geolib3-MT adds a new render type, called Preview Render with Profiling, designed to help track down performance problems in scene traversal. This performs a normal Preview Render, but also captures information about which Ops have run, the amount of CPU used by them to cook locations, and the amount of memory used for attributes and Lua scripts.
A Preview Render with Profiling outputs profiling data in two places:
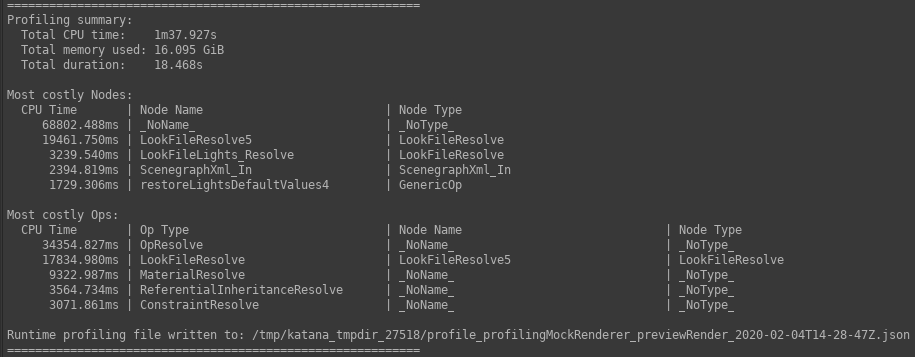
- A summary report in the Render Log, containing total CPU time and memory used, as well as the ten most expensive Ops.
- A JSON file written to disk containing raw profiling data.
Starting a Preview Render with Profiling
A Preview Render with Profiling can be started from the same menu as any other render:
- Right-click on the node you wish to render from.
- Click Preview Render with Profiling from the menu.

This option will be available for any renderer that already supports a Preview Render, and requires no additional work on the part of the renderer. If the renderer implements the finalize() method of the Geolib3-MT runtime, these profiling reports will be created when the runtime is finalized; otherwise reports will be written when the render finishes.
The overhead of capturing profiling data during a Preview Render with Profiling is minimal, and there should not be significant slowdown compared to a normal Preview Render.
What Information is Captured?
A Preview Render with Profiling captures the following information for each Op that is executed during scene traversal:
- The name, type and numerical ID of the Op.
Each Op has name, type and a unique numeric ID. For example, an OpScript Op may have name op74, type OpScript.Lua; and ID 77.Note: The name and ID do not need to correlate.
- The name and type of the
Katana node that spawned the Op.
In cases where an Op is spawned directly by a Katana node, the name and type of that node are recorded. In cases where the Op was created implicitly, the node name will equal _NoName_ and the type will equal _NoType_. This occurs, for example, with MaterialFilenameResolve Ops as these Ops are created implicitly when a file name needs to be resolved, so no Katana node is identified as the creator.Note: If sceneTraversal.opTreeOptimizations is enabled and chains of Ops are collapsed, node name and type will be replaced with a string generated from the chain. If the chain has length t, formed of Ops of type opType, where Op k is named ok and is generated by a Katana node named nk, the general form of the string will be:
cop(o0(n0)->o1(n1)-> ... ->ot(nt))
However, the format of this string is not guaranteed to remain fixed.
- The total CPU time that Op spent cooking locations.
Each Op will cook many locations, and the time spent doing this, across all scene traversal threads, is accumulated. CPU time scales with the number of scene traversal threads when a scene is traversed in parallel. If this is not the case, there may be a thread-unsafe Op upstream of the Op in question. - The memory footprint of that Op.
Each Op must allocate memory to cook locations, and the memory total per Op is aggregated.
At present, the following allocations are recorded:
- Allocations made by the FnAttribute library, to store attributes of cooked locations.
- Allocations made by the Lua interpreter while executing OpScripts.
- Allocations made to store CookResults in the cache.
Profiling Summary Report
A summary report is written to the Render Log upon completion of a Preview Render with Profiling. This report is intended to give a high-level overview of the profile data, and contains:
- The total CPU time, summed across all Ops.
- The total memory footprint, summed across all Ops.
- The slowest five Ops by CPU time.
|
|
| The relevant section of an example Render Log. |
Profiling JSON File
In addition to the summary report, a JSON file containing the raw profiling data is written to disk. The directory it is written to is determined by the --profiling-dir command-line argument; if this is not set, it will be written to the temporary directory for the Katana session. If this directory does not exist, it will be created, as long as file system permissions allow. The file name takes the following format:
profile_<renderer>_previewRender_<datetime>.json
Where:
- <renderer> is the name of the render plugin, e.g. dl for 3Delight;
- <datetime> is the ISO8601 timestamp from when the render was started.
The file contains a single JSON object with the following properties:
|
Property |
Type |
Description |
Example |
|
timestamp |
string |
ISO8601 timestamp at which the profile file was written. |
2019-10-11T09:37:06Z |
|
renderer |
string |
Name of the render plugin. |
dl |
|
renderMethodName |
string |
Name of the render method; currently always previewRender. |
previewRender |
|
environment |
object |
An object containing values of various environment variables, including:
|
{ “KATANA_RELEASE”: “3.5v1”, “KATANA_ROOT”: /opt/foundry/katana3.5v1”, “KATANA_RESOURCES”: “<unset>” } |
|
profileMode |
string |
Name of the profile mode; currently always basic. |
basic |
|
ops |
array |
Array of objects describing resources consumed by each Op. |
See the table below |
|
numOps |
number |
Length of the Ops array. |
78 |
|
wallTime |
number |
Wall-clock time in seconds between render start and the profiling file being written; if the renderer implements finalize(), this equates to scene traversal time. |
46.85064 |
|
cpuTime |
number |
Sum of CPU time for all Ops, in seconds. |
91.39238 |
|
memoryUsed |
number |
Sum of memory footprints for all Ops, in bytes. |
10728607911 |
The ops property contains an array of objects of the following format, one for each Op that was executed during scene traversal.
|
Property |
Type |
Description |
Example |
|
opId |
number |
The unique integer identifier for the Op. |
23 |
|
opName |
string |
The unique name of the Op. |
op223 |
|
opType |
string |
The type of the Op. |
AttributeSet |
|
nodeName |
string |
The name of the Katana node responsible for creating this Op, or _NoName_ if the Op was created implicitly. |
RenderSettings_SetSamples |
|
nodeType |
string |
The type of the Katana node responsible for creating this Op, or _NoType_ if the Op was created implicitly. |
RenderSettings |
|
cpuTime |
number |
The total time this Op spent cooking locations across all threads, in seconds. |
0.54512136 |
|
memoryUsed |
number |
The total memory footprint, as defined above, this Op used while cooking locations, in bytes. |
185378321 |
Analyzing the Profile Results
A Python 2.7 script is included to sort and group the results in various ways. This script can be found here:
$KATANA_ROOT/extras/Profiling/analyzeProfilingRenderResults.py
You can call this Python script from the command line as follows:
cd $KATANA_ROOT/extras/Profiling
python analyzeProfilingRenderResults.py /path/to/results/file.json <options>
The following command-line options are available:
|
--help |
Display the help text and exit. |
|
--sort-by FIELDNAME |
Sort the results by FIELDNAME, where FIELDNAME is one of the JSON property names opId, opName, opType, nodeName, nodeType, cpuTime or memoryUsed. |
|
--reverse, -r |
Sort the results in reverse order. |
|
--group-by FIELDNAME |
Group the results by FIELDNAME, where FIELDNAME is one of the JSON property names opId, opName, opType, nodeName, nodeType, cpuTime or memoryUsed. |
|
--human-readable, -h |
Print memory totals in human-readable units (i.e. KiB, MiB, etc. as appropriate) rather than bytes. |
|
--limit LIMIT, -l LIMIT |
Limit output to the first LIMIT rows after grouping and sorting. |
|
--columns COLUMNS |
Output only the specified columns, where COLUMNS is a comma-separated list of the JSON property names opId, opName, opType, nodeName, nodeType, cpuTime or memoryUsed. |
The script outputs an ASCII table of results to stdout, grouped and sorted as requested. If --sort-by is not set, results will be sorted by opId. If --group-by is not set, no grouping will occur.
Note: When grouping by nodeName, all results with name _NoName_ will be grouped together. The same is true for nodeType.
The following combination of command-line options may be useful to get started:
|
--group-by opType --sort-by cpuTime |
Find out which Op types are most CPU-intensive. |
|
--group-by nodeName --sort-by cpuTime |
Find out which Katana nodes are most CPU-intensive. |
|
--group-by nodeType --sort-by memoryUsed |
Find out which Katana node type accounts for the largest memory footprint. |
Sorry you didn't find this helpful
Why wasn't this helpful? (check all that apply)
Thanks for your feedback.
If you can't find what you're looking for or you have a workflow question, please try Foundry Support.
If you have any thoughts on how we can improve our learning content, please email the Documentation team using the button below.
Thanks for taking time to give us feedback.
