Using Scopes
Nuke provides scopes to help you evaluate your footage. Scopes are accessed from the contents menu, Windows > New Scope sub-menu.
There are a number of global controls (Preferences > Panels > Scopes) that affect how the Scopes display information:
• black point - sets the black out of range warning level.
• white point - sets the white out of range warning level.
• luma/chroma encoding - sets the video standard to use when converting RGB to luma or chroma values in the scope displays, either REC601 or REC709.
• Include viewer color transforms - when enabled, scope data includes the applied Viewer color transforms (gain, gamma, and LUT). When disabled, scope data does not include the applied Viewer color transforms. This may slow down rendering, as it may require image calculation.
• Force full frame - When enabled, scopes display data for the full frame, regardless of what portion of that frame is displayed in the Viewer. When disabled, scopes only display data for the current area requested by the Viewer rather than the full frame.
Histogram
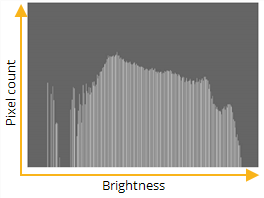
The content menu Windows > New Scope > Histogram provides three color channel and luma channel information that describes the distribution of red, green, blue, and luma pixels throughout the current frame.
The Histogram graphs the number of pixels at each brightness level, and from left to right, the areas of the Histogram represent shadow, mid tones, and highlights.
Tip: You can pan the view area by holding Alt, or the middle mouse button, and dragging in the panel.
There are a number of view controls on the Histogram tab:
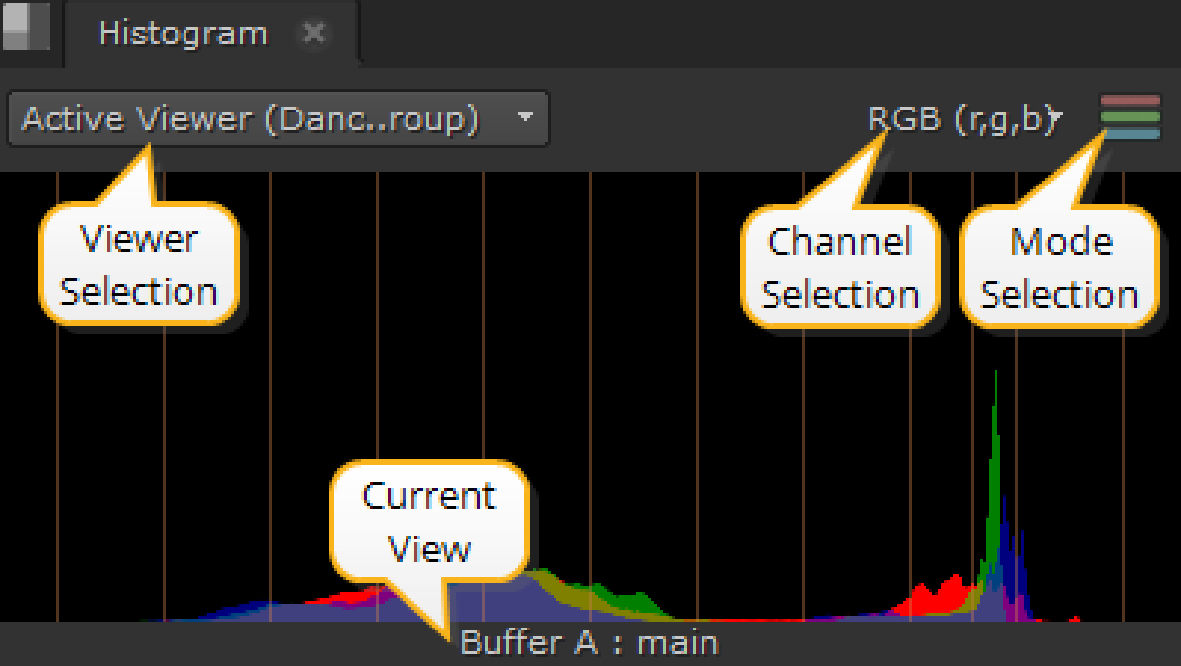
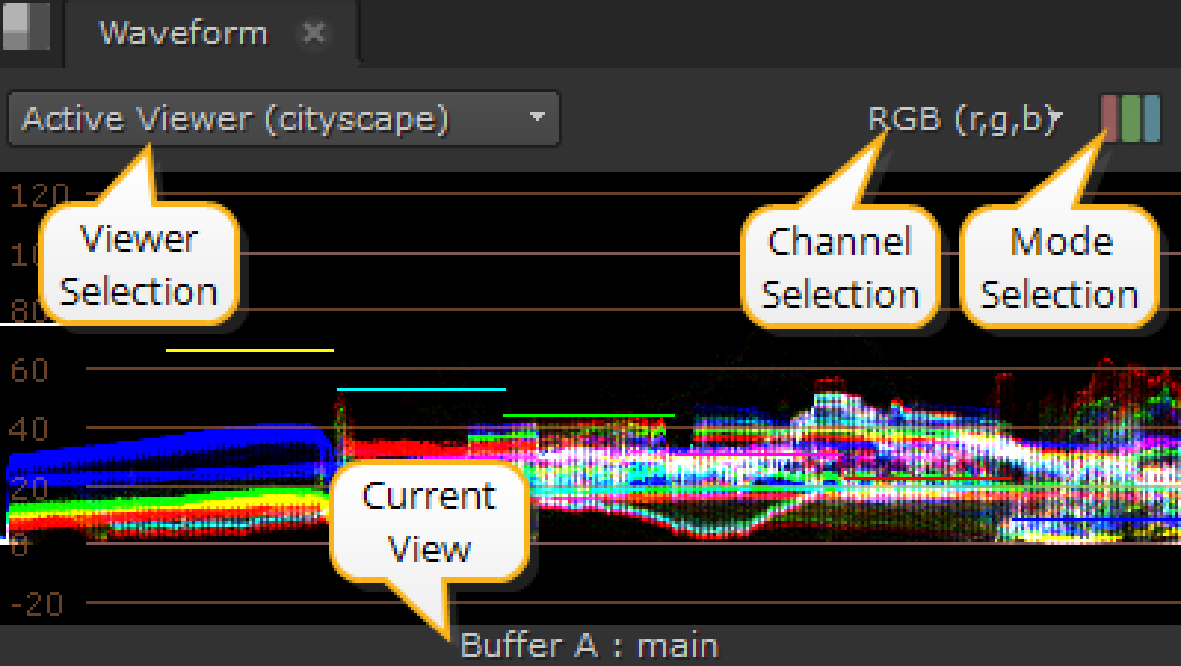
• Viewerselection - if you have multiple Viewers open, use the dropdown menu to associate Histogram output to the required Viewer.
The default value, ActiveViewer, automatically displays details on the last Viewer you selected.
• Channel selection - select the channels to output. The default setting displays RGB, but you can also view channels separately.
• Mode selection - select the mode to output. The default setting displays ganged RGB, but you can also view the channels separately by checking Parade.
• Current View - describes the view currently displayed in the scope, whether it's the A or B buffer and the view. The view defaults to main, unless main has been replaced in multi-view scripts or projects.
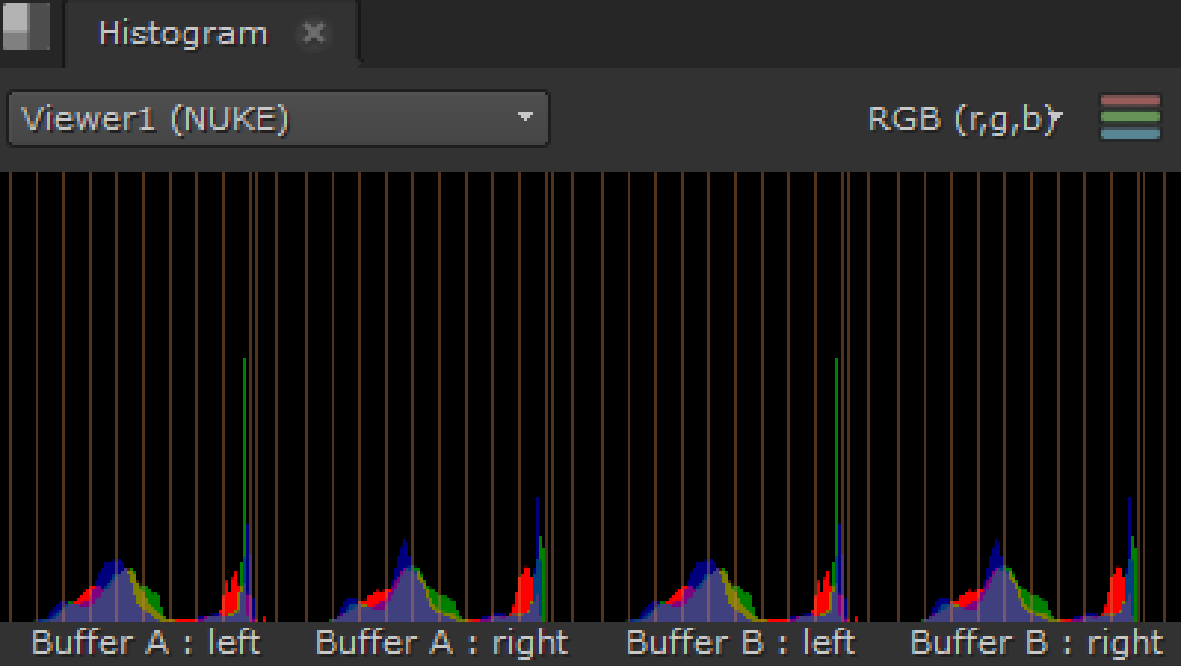
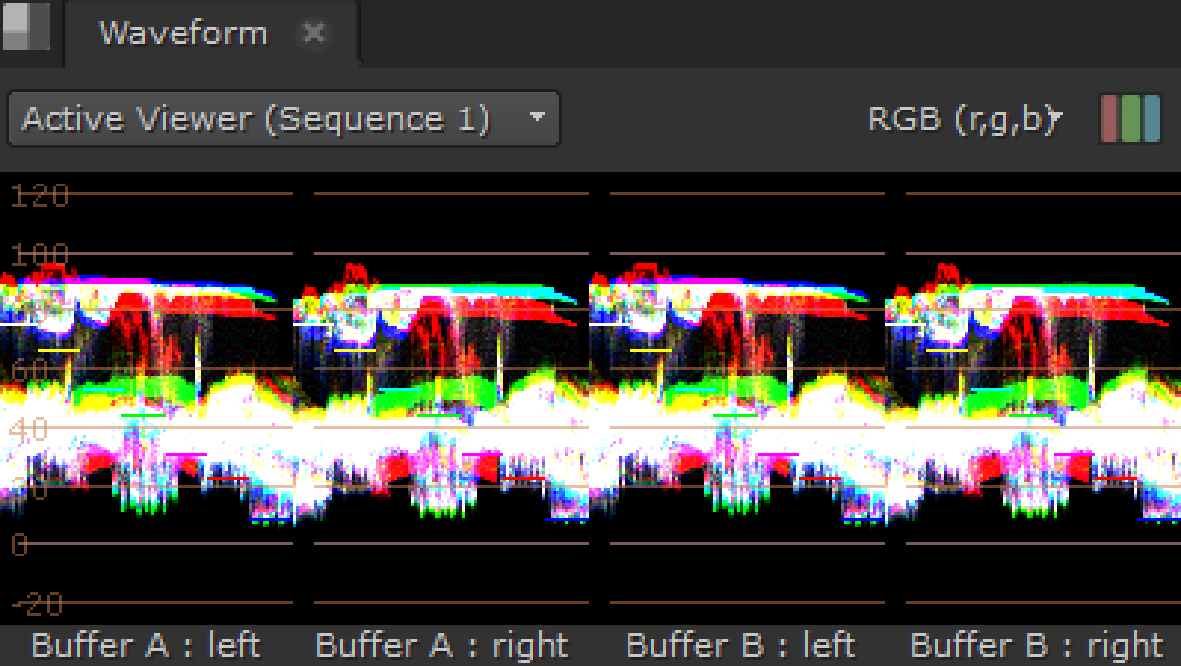
Depending on which Viewer tools and views you have active, you can have up to four scopes displayed at once.
For example, with two stereo Read nodes, one in each input buffer, and wipe and Anaglyph active, the scopes display something like this:
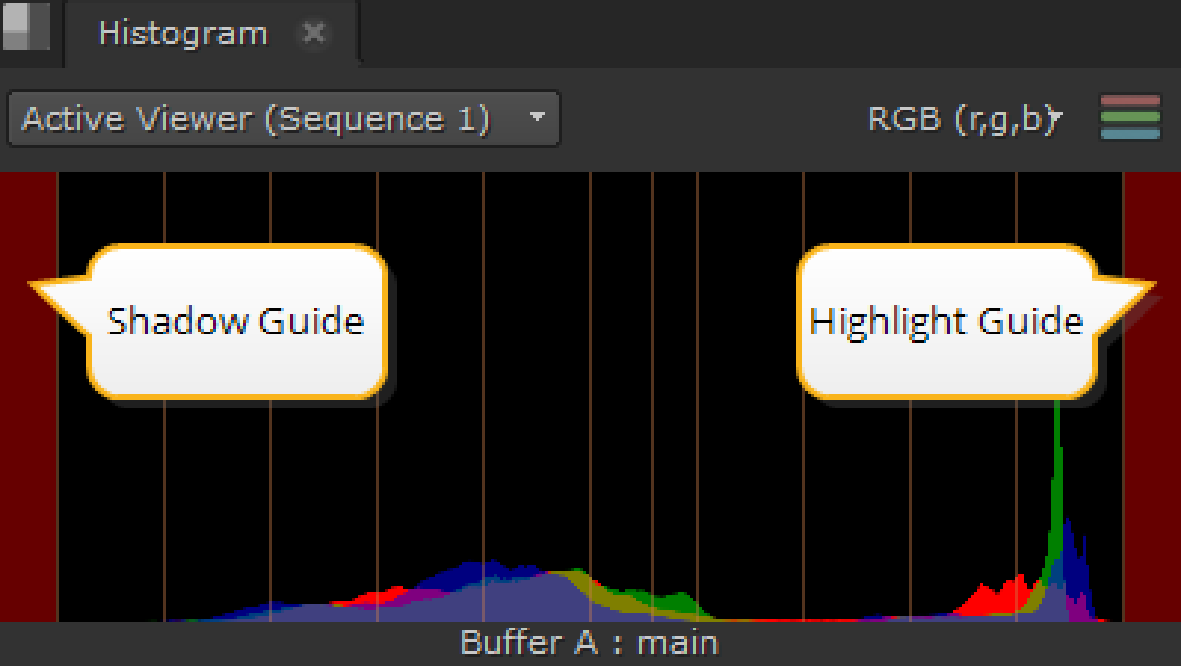
The scopes feature global customizable guides to help you view data. Navigate to Preferences > Panels > Scopes and enter values between 0 and 1 for Blackpoint and Whitepoint.
The guides at the edges of the Histogram turn red to warn you when the distribution is out of range:
Using the Histogram Node
The properties panel for the Histogram node includes a window that graphs the number of pixels at each brightness level. This is a useful gauge to see whether an image has a good distribution of shadows, midtones, and highlights.
|
| The histogram maps the distribution of shadows, midtones, and highlights. |
To Define Tonal Range with the Histogram Node
| 1. | Click Color > Histogram to insert a Histogram node at the appropriate place in your script. |
| 2. | Connect a Viewer to the output of the Histogram node so you can see the effect of your changes. |
| 3. | Drag the leftmost input range slider till it roughly lines up with the initial boundary of the histogram. |
| 4. | Drag the rightmost input range slider till it roughly lines up with the final boundary of the histogram. |
| 5. | Drag the middle input range slider to define the midtone, or neutral, value. |
Waveform
The content menu Windows > New Scope > Waveform scope provides information on luminance, or brightness, which you can use to decide whether the footage is over or under exposed. The information represents luminance values from 0 - 100% (black through the spectrum to white). The higher the waveform, the brighter the image in the Viewer.
Tip: You can pan the view area by holding Alt, or the middle mouse button, and dragging in the panel.
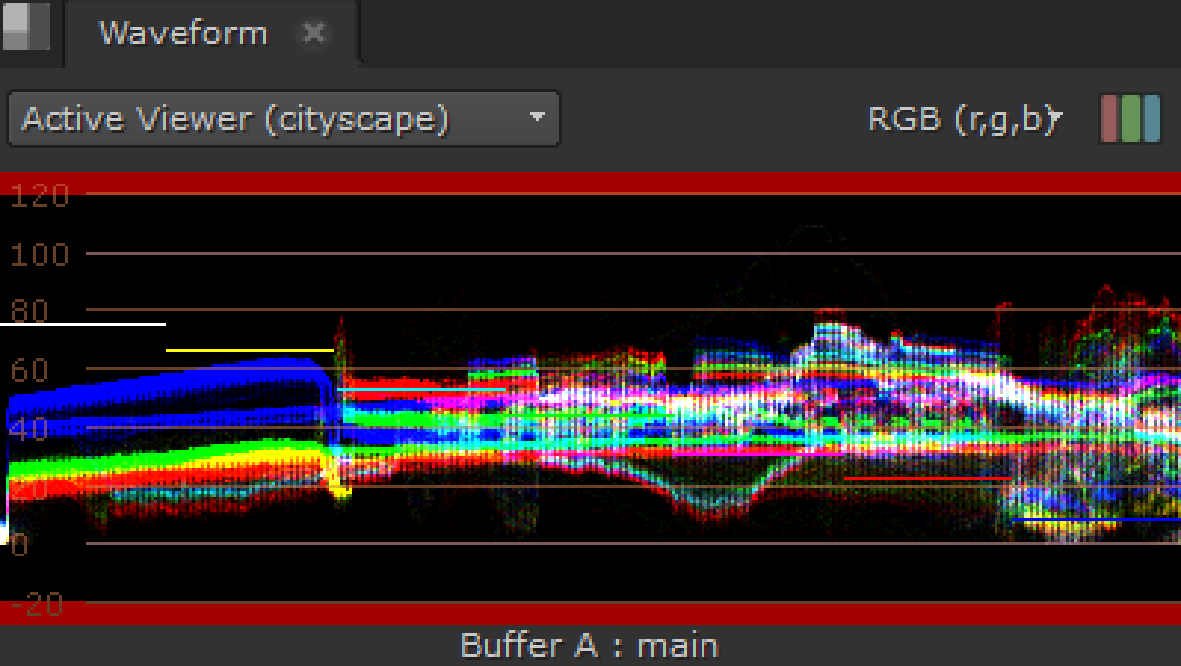
The upper white marker is used to measure when over exposure could be a problem. If your waveform has a lot of traces over the white marker, you could consider reducing the brightness of the image. The opposite is true of the lower black marker.
There are also Viewer and Channel selection controls on the Waveform tab:
• Viewer selection - if you have multiple Viewers open, use the dropdown menu to associate Waveform output to the required Viewer.
The default value, Active Viewer, automatically displays details on the last Viewer you selected.
• Channel selection - select the channels to output. The default setting displays RGB, but you can also view channels separately.
• Mode selection - select the mode to output. The default setting displays ganged RGB, but you can also view the channels separately by checking Parade.
• Current View - describes the view currently displayed in the scope, whether it's the A or B buffer and the view. The view defaults to main, unless main has been replaced in multi-view scripts or projects.
Depending on which Viewer tools and views you have active, you can have up to four scopes displayed at once.
For example, with two stereo Read nodes, one in each input buffer, and wipe and Anaglyph active, the scopes display something like this:
The scopes feature global customizable guides to help you view your data. Navigate to Preferences > Panels > Scopes and enter values between 0 and 1 for Blackpoint and Whitepoint.
The guides at the top and bottom of the Waveform turn red to warn you when the distribution is out of range:
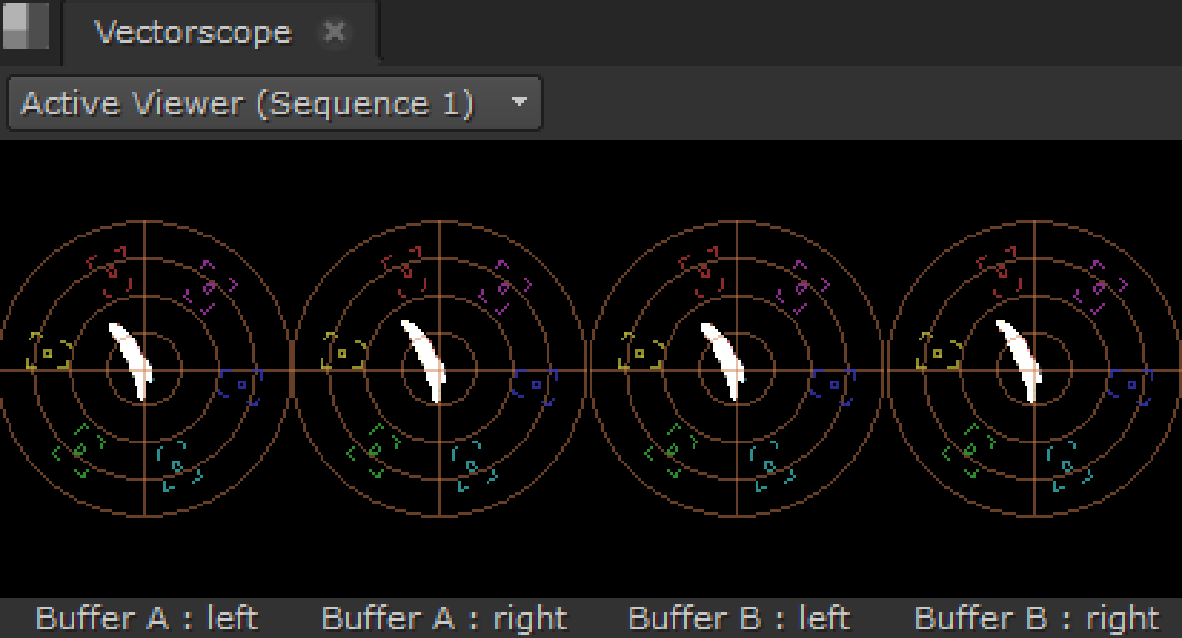
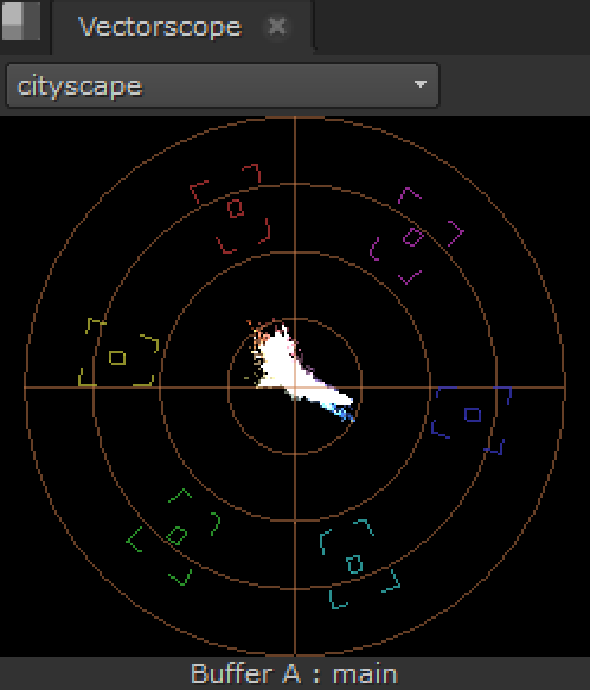
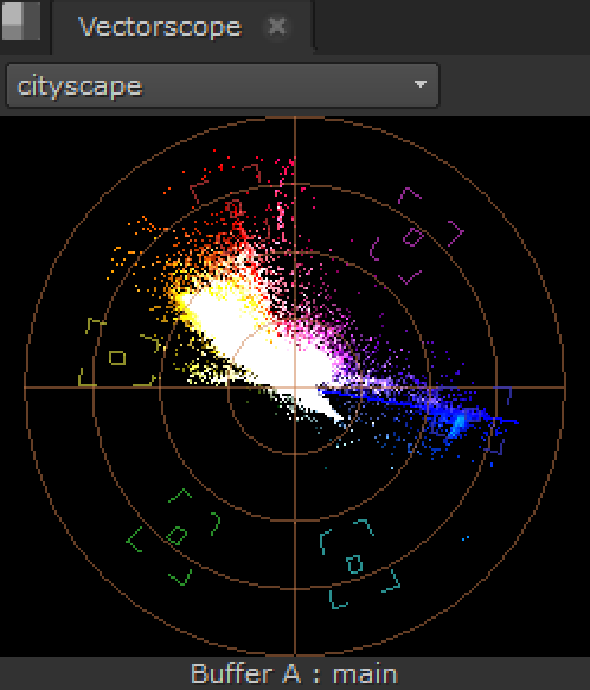
Vectorscope
The content menu Windows > New Scope > Vector display color, saturation, and hue information for the current frame. Similar to color wheels, vector scopes display information radially, from the center outward. The farther from the center the data spans, the more saturation is represented.
In the image on the left, you can see that the frame represented contains mostly yellows and reds, but the values are not oversaturated. The image on the right represents a badly saturated frame. Notice the spill of red traces distributed toward the edge of the scope pass the target (the highlighted square).
|
|
|
| Normal saturation. | High Saturation. |
Tip: You can pan the view area by holding Alt, or the middle mouse button, and dragging in the panel.
There is also a Viewer selection control on the Vectorscope tab:
• Viewerselection - if you have multiple Viewers open, use the dropdown menu to associate vector scope output to the required Viewer.
The default value, ActiveViewer, automatically displays details on the last Viewer you selected.
• Current View - describes the view currently displayed in the scope, whether it's the A or B buffer and the view. The view defaults to main, unless main has been replaced in multi-view scripts or projects.
Depending on which Viewer tools and views you have active, you can have up to four scopes displayed at once.
For example, with two stereo Read nodes, one in each input buffer, and wipe and Side by Side active, the scopes display something like this: