Filtering Profile Data
The Profile tab's FILTER dropdown allows you to output only the profiling data you need, but the full data type set selected in the PROFILE dropdown remains available if you change your mind.
The following controls determine what output is available on-screen and for export to .csv or .xml file:
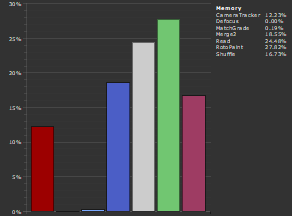
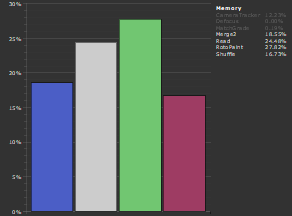
• minimum threshold - allows you to hide display data that doesn't reach a certain minimum value. For example, setting the threshold to 15% can hide any nodes that don't use at least 15% of the available memory.
|
|
|
|
0% minimum threshold. |
15% minimum threshold. |
Tip: You can zoom in and out of the DATA pane using the ![]() buttons.
buttons.
• display data - determines what data is displayed from CPU, wall, ops, and memory. The default, all, displays all the available profiling data:
• CPU - the time that the CPU spent executing the processing code, in microseconds, aggregated over all CPU threads. For example, with multi-threaded processing this is typically much larger than the wall time. If the average CPU time per thread (CPU divided by the number of threads used) is much shorter than the wall time, this suggests the CPU threads have spent a lot of time not executing code and perhaps waiting on locks, which could indicate a performance problem.
Note: On Mac and Windows, the CPU time is not currently accurate. On Mac, the CPU value is always similar to the wall time.
• wall - the time taken as it would be measured by a clock on the wall - the actual time you have to wait for the processing to complete. The wall time is also measured in microseconds.
• ops - the number of operators called in the node. Operators are Nuke's building blocks that perform certain tasks. Nodes can contain one or more ops. For example, when a node needs to resize something it would use a Transform op rather than an implementation of its own to do the same thing.
See https://learn.foundry.com/nuke/developers/17.0/ndkdevguide/intro/terminology.html#op for more information.
• memory - the total amount of system memory used by the node.
Tip: Bear in mind that some node classes also contain numerical values to differentiate between current and deprecated classes, such as Text and Text2.
• display nodes - for large scripts, it is impractical to display all the nodes in the Node Graph in the Profile tab. In bar, pie and timeline mode, only the top 15 results by resource usage are listed. In table mode, all results are listed.
The display nodes control allows you to be more selective with your output:
• all - displays data for all the nodes in the script.
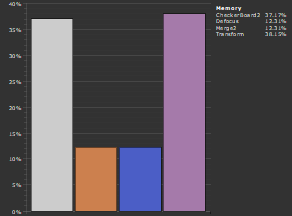
• list - enter the explicit node names to display in the DATA panel. You can type the names manually or select nodes in the Node Graph and then click add selected.
You can also find nodes listed in the FILTER panel by clicking select to highlight them in the node tree.
|
|
|
|
With display nodes set to all. |
With display nodes set to a list. |
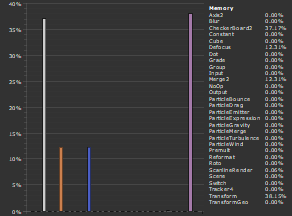
You can display data by node class, such as CameraTracker, or explicitly by node name, such as Read2.
Tip: You can zoom in and out of the DATA pane using the ![]() buttons.
buttons.
• display frames - allows you to view a sub-set of the profiled frames:
• average - the mean average of all the frames specified by the display frames control.
• per frame - allows you to step through all the frames in the display frames range using the ![]() buttons.
buttons.
• chart type - sets the form of the output produced from the profiling data:
• bar or pie chart, and timeline - displays the top 15 results by resource usage.
• table - displays all results in table form, a visual representation of the .csv or .xml file output.