Using Visual Diagnostics
Nuke can display accurate script profile data onscreen or output it to .csv or .xml file to help you troubleshoot bottlenecks in slow scripts. When visual diagnostics are calculating, timing information is displayed in the Node Graph, and the nodes themselves are colored according to the proportion of the total processing time spent in each one. The data is then displayed in the Profile tab as a bar or pie chart, timeline, or as a table.
Enabling Visual Diagnostics
Nuke's visual diagnostics use Profile nodes in the node tree to gather data. You can add as many Profile nodes as required, but one strategy might be to start at the foot of the Node Graph and work your way up until CPU or memory load decreases significantly.
Note: Profile nodes add processing overhead, but the data gathered still provides an accurate picture of where processing time is spent in the script.
| 1. | Navigate to Image > Profile to add a Profile node to the Node Graph. |
| 2. | Connect the Profile node to the point in the node tree where you want to collect profiling data. |
Note: You cannot connect Profile nodes directly to 3D, Particle, or Deep nodes. To profile these nodes, you'll need to render their output through a render node, such as ScanlineRender, RayRender, or a third-party renderer like PRManRender.
| 3. | Click open profile panel in the node properties or click the content |
The Profile tab opens.
| 4. | Click the profile node dropdown and then select the a Profile node in the Node Graph by name, |
OR
Select the a Profile node in the Node Graph and then choose selected.
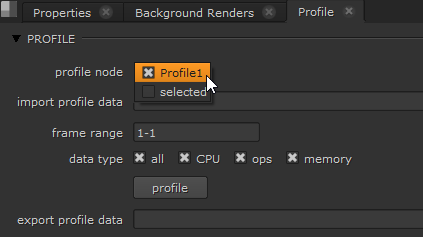
| 5. | Set the frame range to collect data from and the required data type using the checkboxes. |
Tip: The initial frame range is determined by the Project Settings > frame range control and all data types are collected by default. The frame range control accepts complex ranges, such as 1-10, 15-25 and 1-200x10. See Defining Frame Ranges for more information.
| 6. | Click profile to start data collection. |
Note: If you've imported existing profiling data from a .csv or .xml file, you can't profile the current script. See Exporting and Importing Profile Data for more information.
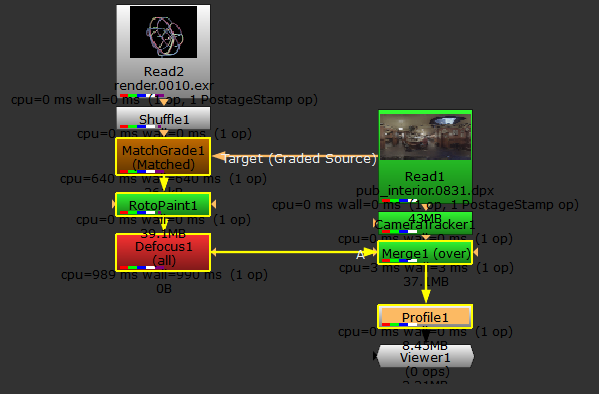
As the specified frame range is calculated, timing information is displayed and the nodes in the Node Graph are colored according to the proportion of the total processing time spent in each one.
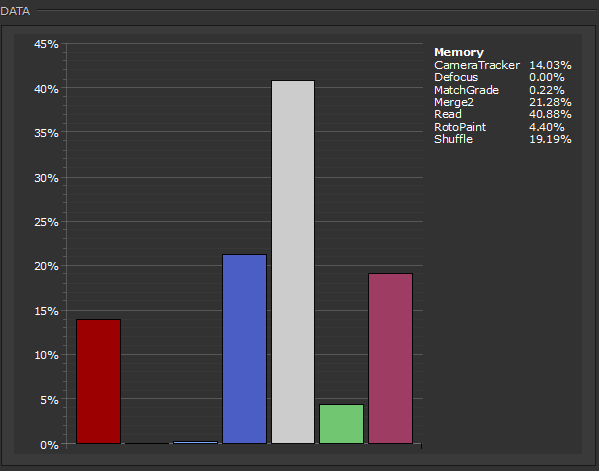
The profiling data is stored in the Profile tab's DATA panel when complete. See Filtering Profile Data for information on how to control what profiling data is displayed.