DisparityViewer
Description
The O_DisparityViewer node allows you to visualize the disparity vectors in your node tree, display a histogram detailing positive and negative parallax, or overlay the Viewer with parallax violations.
Note: All three O_DisparityViewer modes are baked into your render if the node is enabled when you write your sequence out. This allows you to render the output alongside disparity for review.
You can add O_DisparityViewer after any node in the Node Graph. As long as there is a disparity channel at that point in the tree, O_DisparityViewer produces a Viewer overlay with arrows showing the disparity vectors at regular intervals, a histogram, or parallax violations depending on the Display control.
O_DisparityViewer allows you to view diagnostic tools to help you determine where your stereo footage needs work:
• DisparityViewer - the disparity vectors at any given point in your node tree for a selected view or both views.
• Displaying Parallax Histograms - a histogram showing the parallax, in pixels, on the x axis, the number of image pixels on the y axis, and the negative and positive parallax violation areas in red and green, respectively.
• Displaying Parallax Violation Overlays - highlights the areas of negative and positive parallax violation - that is, areas outside the limits specified in the Negative Limit and Positive Limit controls.
Displaying Disparity Vectors
To visualize the disparity vectors at any given point of your node tree, do the following:
| 1. | Select a node at any point in the node tree where there is a disparity channel. |
If you don’t have a disparity channel in the data stream, you can add one using an O_DisparityGenerator node. See DisparityGenerator for more information.
| 2. | Choose Ocula > Ocula 4.0 > O_DisparityViewer from the Toolbar. |
This inserts an O_DisparityViewer node in your node tree.
| 3. | Under Views to Use, select the views you want to use to visualize the disparity vectors. These views are mapped for the left and right eye. |
| 4. | Using the Display menu, select DisparityVectors. |
| 5. | If you want to display the vectors for both views rather than just the current view, check Show Both Directions. |
|
|
|
|
Vectors for the left view. |
Vectors for both views. |


| 6. | Zoom in to better see the disparity vectors in the overlay. |
| 7. | If the Viewer seems too cluttered or the arrows overlap, increase the Vector Spacing value. |
| 8. | If necessary, use the disparityR and disparityL parameters to change the color of the arrows. You may want to do this, for example, if the default color is very close to the colors in your input image, or if you want to compare disparity methods and have more than one O_DisparityViewer overlay displayed at once. See O_DisparityViewer Controls for more information. |
Note: Disparity vectors are baked into your render if the node is enabled when you write your sequence out.
Displaying Parallax Histograms
To view a parallax histogram for any given point of your node tree, do the following:
| 1. | Select a node at any point in the node tree where there is a disparity channel. |
If you don’t have a disparity channel in the data stream, you can add one using an O_DisparityGenerator node. See DisparityGenerator for more information.
| 2. | Choose Ocula > Ocula 4.0 > O_DisparityViewer from the Toolbar. |
This inserts an O_DisparityViewer node in your node tree.
| 3. | Under Views to Use, select the views you want to use to visualize as a histogram. These views are mapped for the left and right eye. |
| 4. | Using the Display dropdown menu, select Parallax Histogram. |
|
|
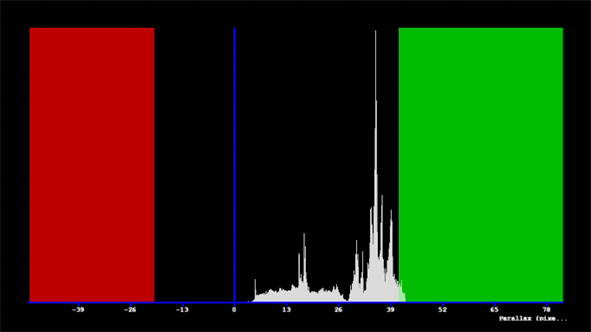
| Parallax histogram. |
The Viewer displays a histogram showing Parallax (in pixels) on the x axis, the number of image pixels on the y axis, and the negative and positive parallax violation areas in red and green, respectively.
The screen is placed at zero on the x axis, so negative parallax refers to parts of the image that are in front of the screen and positive parallax to the parts that are behind the screen.
| 5. | Use the Histogram controls to define your histogram as necessary. See O_DisparityViewer Controls for more information. |
Note: Histograms are baked into your render if the node is enabled when you write your sequence out.
Displaying Parallax Violation Overlays
To view a parallax violation overlay for any given point of your node tree, do the following:
| 1. | Select a node at any point in the node tree where there is a disparity channel. |
If you don’t have a disparity channel in the data stream, you can add one using an O_DisparityGenerator node. See DisparityGenerator for more information.
| 2. | Choose Ocula > Ocula 4.0 > O_DisparityViewer from the Toolbar. |
This inserts an O_DisparityViewer node in your node tree.
| 3. | Under Views to Use, select the views you want to use to visualize parallax violation. These views are mapped for the left and right eye. |
| 4. | Using the Display dropdown menu, select Parallax Violation. |
|
|
|
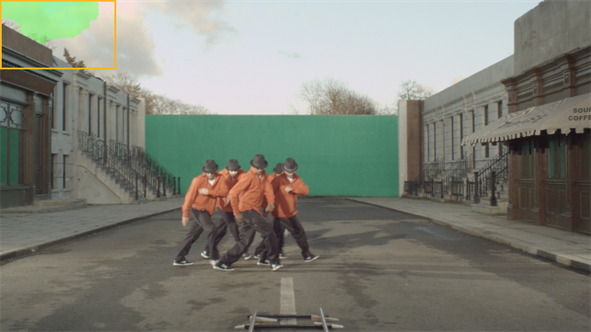
Parallax violation overlay. |

The parallax violation overlay appears in the Viewer, highlighting the areas of negative and positive parallax violation - that is, areas outside the limits specified in the Negative Limit and Positive Limit controls.
| 5. | Use the Parallax controls to define your overlay parameters as necessary. See O_DisparityViewer Controls for more information. |
Note: Parallax violation overlays are baked into your render if the node is enabled when you write your sequence out.
Inputs
O_DisparityViewer has the following inputs:
|
Source |
This is any node in the node tree with a disparity map in the disparity channels. |
To see a table listing the nodes or channels each Ocula node requires in its inputs, see Node Dependencies.
O_DisparityViewer Controls
Views to Use
From the views that exist in your project settings, select the two views you want to use when visualising the disparity vectors. These views are mapped for the left and right eye.
Display
Select the display mode from the dropdown menu:
|
Disparity Vectors |
Overlays the disparity vectors at any given point in your node tree for a selected view or both views. |
|
Parallax Histogram |
Displays a histogram showing the parallax, in pixels, on the x axis, the number of image pixels on the y axis, and the negative and positive parallax violation areas in red and green, respectively. |
|
Parallax Violation |
Highlights the areas of negative and positive parallax violation - that is, areas outside the limits specified in the Negative Limit and Positive Limit controls. |
Vectors
|
disparityR |
Color of the arrows used for displaying left-to-right disparity. You may want to change this, for example, if the color of the arrows is very close to the colors in your input image, or if you want to compare the vectors from multiple O_DisparityViewers in the same Viewer. |
|
disparityL |
Color of the arrows used for displaying right-to-left disparity. You may want to change this, for example, if the color of the arrows is very close to the colors in your input image, or if you want to compare the vectors from multiple O_DisparityViewers in the same Viewer. |
|
Show Both Directions |
Check this to show the disparity vectors for both views rather than just the current view. |
|
Vector Spacing |
How often a disparity vector is drawn. If necessary, you can increase this value to make the display less cluttered. You may want to do so, for example, if the disparities are large and you don’t want neighboring vectors to overlap one another. |
Histogram
|
Histogram Range |
Use this menu to select the histogram range: • Automatic - the range is scaled to fit the range of disparity. • User Defined - the range is defined using the Histogram Min and Max controls as a percentage of screen width. |
|
Histogram Min |
Controls the lower limits of the histogram as a percentage of screen width, that is, the left-most points on the x axis. Note: This control is only active when Histogram Range is set to UserDefined. |
|
Histogram Max |
Controls the upper limits of the histogram as a percentage of screen width, that is, the right-most points on the x axis. Note: This control is only active when Histogram Range is set to UserDefined. |
Parallax
|
Negative Limit |
Sets the amount of negative parallax allowed as a percentage of screen width. Areas outside this negative limit are marked by the overlay in the color specified in the Negative Violation control. |
|
Pixels |
Displays the number of pixels allowed by negative parallax. |
|
Positive Limit |
Sets the amount of positive parallax allowed as a percentage of screen width. Areas outside this positive limit are marked by the overlay in the color specified in the PositiveViolation control. |
|
Pixels |
Displays the number of pixels allowed by positive parallax. |
|
Negative Violation |
Sets the overlay color for pixels outside the specified Negative Limit value. |
|
Positive Violation |
Sets the overlay color for pixels outside the specified Positive Limit value. |
O_DisparityViewer Example
In this example, we use O_DisparityViewer to evaluate the disparity map produced by O_DisparityGenerator. For information on where to get the sample footage, please see Example Images.
Step by Step
| 1. | Start Nuke and press S on the Node Graph to open the Project Settings. Go to the Views tab and click the Set up views for stereo button. |
| 2. | Select Image > Read and browse to where you saved the tutorial files. Go to the O_DisparityGenerator directory, select Dance_Group.exr, and click Open. |
A Read node is added to the Node Graph.
Tip: If you've already run through the O_DisparityGenerator Example to create a disparity map, you can open the image you rendered earlier and skip to step 4.
| 3. | Select Ocula > Ocula 4.0 > O_DisparityGenerator from the Toolbar. |
This inserts an O_DisparityGenerator node.
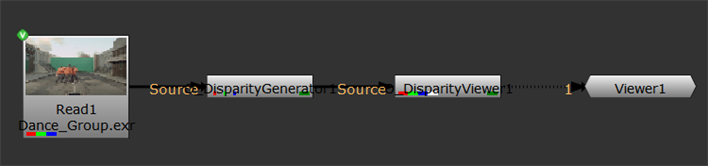
| 4. | Select the O_DisparityGenerator node (or the Read node pointing to your own pre-rendered image) and choose Ocula > Ocula 4.0 > O_DisparityViewer from the Toolbar. |
This inserts an O_DisparityViewer node and forces Ocula to calculate the disparity channel.
| 5. | Connect a Viewer to the O_DisparityViewer node so we can see what’s happening. Your node tree should look similar to the image shown. |
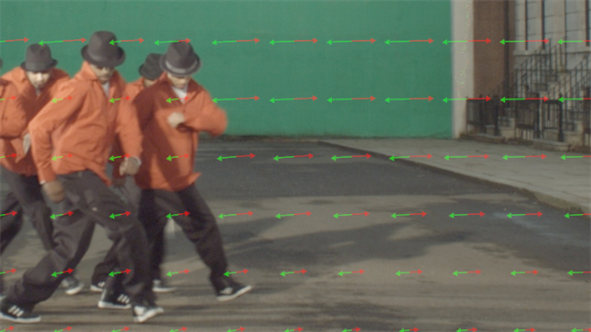
| 6. | Using the default O_DisparityViewer settings, the Viewer is a little crowded. To make the display less cluttered, set Vector Spacing to 80. |
| 7. | To display vectors for both views, check Show Both Directions in the O_DisparityViewer controls. The vectors for the left-to-right disparity are shown in red, and the vectors for the right-to-left disparity in green. |
The main purpose of this tutorial is to show you how to use the Parallax Histogram and Parallax Violation display modes.
| 8. | In the O_DisparityViewer controls, click on the Display dropdown menu and select Parallax Histogram. |
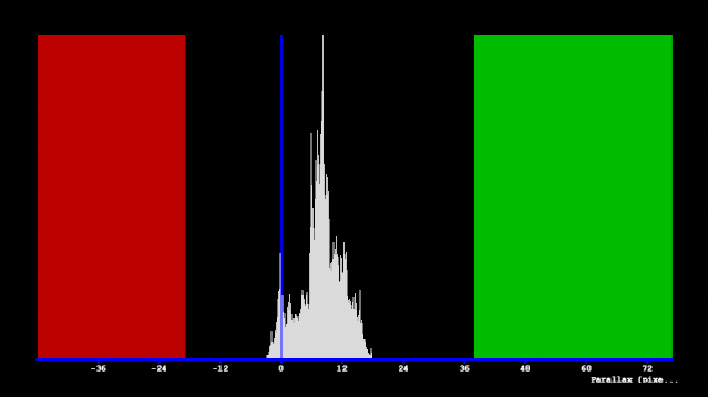
The Viewer displays a histogram showing parallax (in pixels) on the x axis, the number of image pixels on the y axis, and the negative and positive parallax violation areas in red and green, respectively.
Note: The screen is placed at zero on the x axis, so negative parallax refers to parts of the image that are in front of the screen and positive parallax to the parts that are behind the screen.
HistogramRange defaults to UserDefined, so the graph produced may not contain all the pixels in the image.
| 9. | Click the Histogram Range menu and select Automatic. |
The histogram is re-rendered to automatically fit the range of disparities in the image.
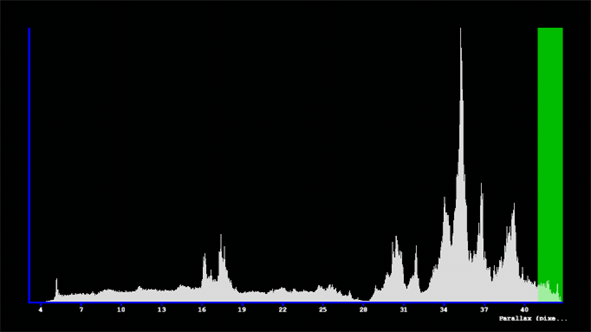
As you can see in this example, a small proportion of the image exceeds the positive violation threshold (green) and none of the image exceeds the negative threshold (red).
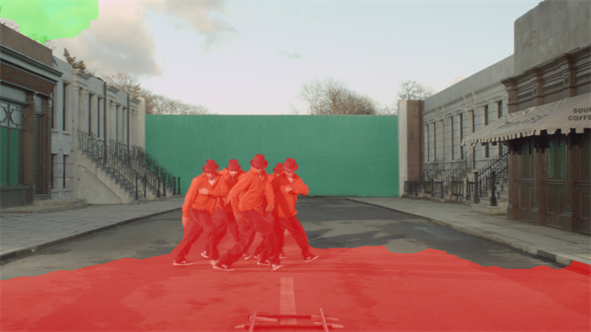
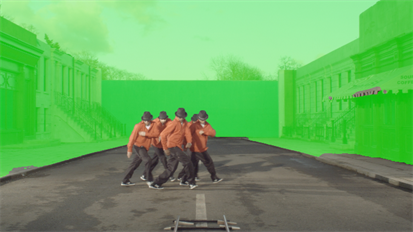
| 10. | In the O_DisparityViewer controls, click on the Display menu and select ParallaxViolation. |
The parallax violation shown in the histogram is overlaid on the Viewer highlighting, in this case, the areas of positive parallax violation.
| 11. | If you adjust the Positive Limit slider down to 1.4 and up to 3, you can see the changing extent of the positive violation limit. In the right-hand image, the violation has disappeared completely. |
|
|
|
|
Low Positive Limit. |
High Positive Limit. |

| 12. | You can adjust the Negative Limit in the same way, though in this case you’ll need to input a figure greater than 0 to see any violation. |