Train and Monitor the Network
For more details on Machine Learning with CopyCat in NukeX, see https://learn.foundry.com/nuke#machine-learning-compositing-in-nuke.
Train the Network to Perform a Task
After setting up your data set of Input and Ground Truth image pairs, you're ready to train the network using machine learning to replicate the desired effect. There are a number of settings available to fine-tune your model, but they are generally trade-offs between training speed and the quality of the result from the network.
- Enter the path to the Data Directory.
- Set the Epochs or number of times CopyCat processes the entire data set during training. Epochs are also used to determine the number of Total Steps plotted on the Graphs tab using the following equation:
- In the Advanced controls, you can add Initial Weights for certain tasks and set the Model Size, Batch Size, and Crop Size. These controls are trade-offs between training speed and the quality of the result from the network. Larger values may also cause your GPU to run out of memory.
-
Note: Multi-GPU processing requires a Batch Size greater than or equal to the number of GPUs you want to use. For example, if you have two GPUs, CopyCat's Batch Size must be set to two or higher to use both GPUs. If you have four GPUs and you set the Batch Size to two, CopyCat only uses two GPUs.
If you want to use GPUs individually to train multiple networks at the same time, see Train Networks from the Command Line. - You can use the Checkpoint Interval and Contact Sheet Interval to determine how often .cat and .png files are written to the Data Directory. For example, a Total Steps value of 5000 and Checkpoint Interval of 1000 would produce 5 .cat files over the course of the training.
- Click Start Training to begin teaching the network how to replicate the desired effect.
- Click the Progress tab to view the training progress represented as a graph of Step/Loss.
The output files created by the training process are stored here in the following formats:
• .png - contact sheets and previews showing the progress of the training.
Note: Preview images are only available if the optional Preview input is connected. See Previewing the Result for more information.
• .cat - files produced by the training and used by the Inference node to apply the learned effect to the sequence. The .cat files are saved at the Checkpoint Interval and contain all the training data up to that point.
• .ost - progress files that allow you to resume training should the process fail or be stopped manually.
• .summary - records the loss value at each step so that the results of multiple Runs can be displayed in CopyCat's Graphs tab.
See Monitor Training to Get the Best Result for more information about the contents of the Data Directory.
Total Steps = Epochs * (Data Set Size) / (Batch Size)
Higher values generally produce better trained networks, but at the cost of longer processing times.
• Initial Weights - Sets whether training begins from scratch or from weighting defined by a previous model:
• None - the training begins from scratch with no weighting applied.
• Checkpoint - the training uses weighting from a previously trained .cat file, which is saved to the Data Directory every 1000 steps by default.
• Deblur - the training starts with a model weighted towards deblur effects, which can improve the training results for similar operations.
• Upscale - the training starts with a model weighted towards upscaling, which can improve the training results for similar operations.
• Human Matting - the training starts with a model weighted towards rotoscoping humanoid shapes, which can improve the training results for similar operations.
In this workflow example, selecting Human Matting may decrease the number of Epochs required to achieve the same result.
• Model Size - trade off speed and memory use against better results. Small models are faster to train and use the least GPU memory, but Large models may produce better results for more complex tasks.
• Batch Size - calculated automatically using the available GPU memory by default. You can set Batch Size to Manual and set the size to suit your data set and GPU memory, but the size must be less than or equal to the number of image pairs in your data set.
Tip: The automatic Batch Size calculation is designed to be quite conservative, so feel free to adjust it manually if you think your machine can handle larger batches.
• Crop Size - the size of the random crops taken from the data set image pairs. Larger values generally produce more accurate results, but at the expense of processing time and memory.
In our tests, the default 256 was suitable for most scripts, but data sets of larger images sizes may require a larger Crop Size to train effectively.
The Crop Size also affects the size of the grids in the contact sheets written to the Data Directory. See Monitor Training to Get the Best Result for more information about the contents of the Data Directory.
If you find that training takes a long time or uses too much memory, try reducing the Crop Size control.
See Monitor Training to Get the Best Result for more information about the contents of the Data Directory.
Monitor Training to Get the Best Result
As the training progresses, it's important to monitor the progress of the machine learning to get the best result. You can monitor progress using CopyCat's Properties panel Progress tab, by examining the Viewer crop overlay and corresponding contact sheets, and by connecting the optional Preview input on the CopyCat node to the source sequence.
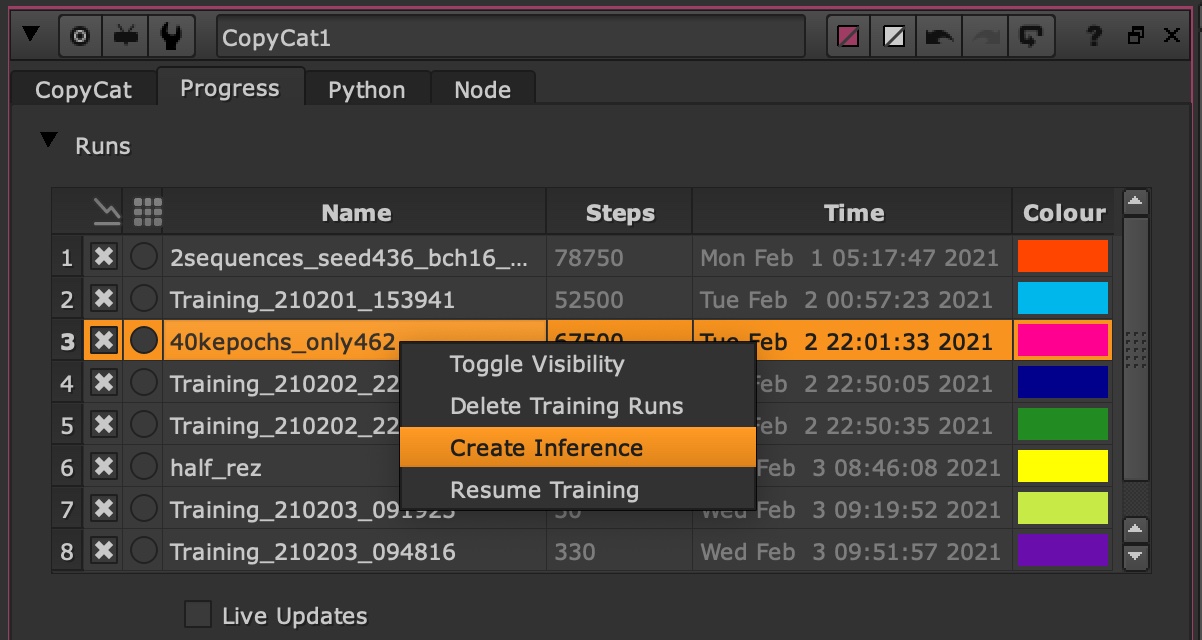
Runs Table
The Runs table allows you to manage the different training runs contained within your chosen data directory. Each new training run will appear in the Runs table.
-
Name - Rename runs to keep track of different experiments. The default naming convention is based on the time the training session was started
[Training_<year><month><day>_<hour><minute><second>]. -
 Graph Visibility - toggle the visibility of each run in the Graph.
 -
 Contact Sheet - choose which run to display in the contact sheet.
You can right-click on one or more training runs in order to toggle the visibility within the graph; delete the files associated with that training run; create an inference node referencing the cat file produced by that training run; or simply resume training that run.
If you’re using another session of Nuke, either locally or via distributed training, enable the Live Updates option and Nuke will actively monitor the files in your data directory and update the graph and contact sheet.
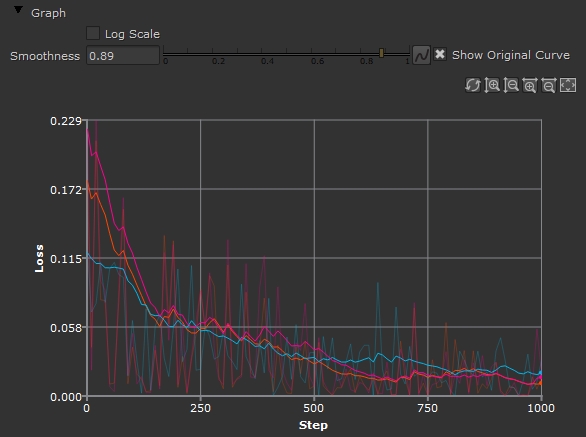
Monitoring the Graph
As the network completes passes through the data set, you'll see the graph for the current training steadily decline toward zero on the Loss axis. You'll also notice that the Viewer displays a crop overlay showing a grid of images.
- Open CopyCat's Properties panel and switch to the Progress tab.
- Use the zoom controls above the graph to control the scale:
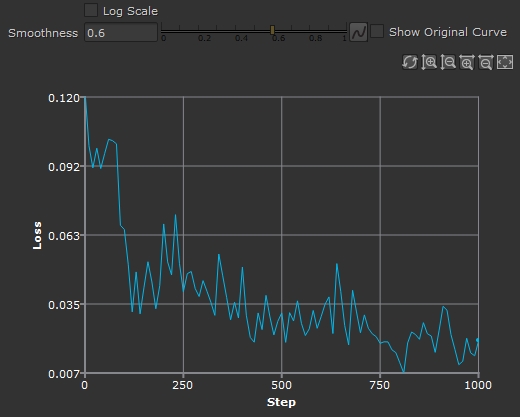
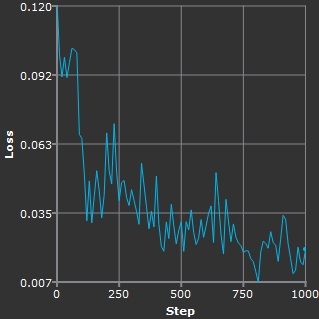
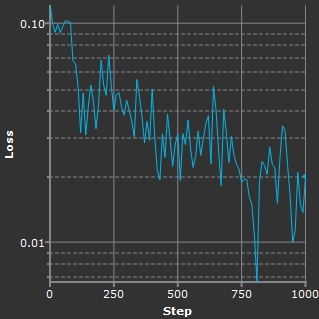
- You can enable Log Scale to allow you to see more detail as the graph approaches 0 on the Loss axis.
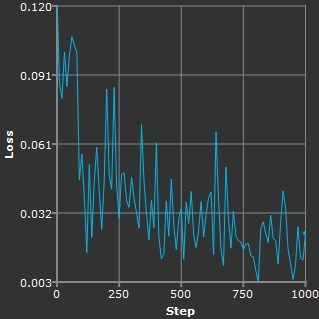
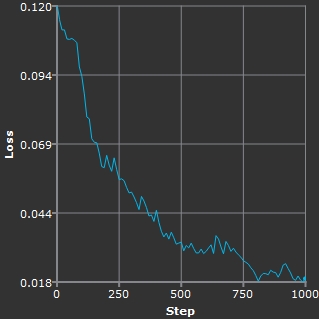
- You can also use the Smoothness control to get a better idea of the general trend of the graph as training progresses. Higher values smooth the curve to show a more accurate trend over time and lower values show the actual values, which can fluctuate dramatically.
The graph plots the number of steps against loss. Steps begins at 0 and ends at the total number of steps calculated using the following equation:
Total Steps = Epochs * (Data Set Size) / (Batch Size)
The Data Set is the number of Input and Ground Truth image pairs connected to CopyCat.
For example, 10000 Epochs over a data set of 6 image pairs with a Batch Size of 4 is equal to 15000 steps.
•
![]() Refresh - click to force a graph refresh between automatic refreshes of the data.
Refresh - click to force a graph refresh between automatic refreshes of the data.
•
![]() Zoom Y in/out - increase or decrease the zoom level on the Y axis.
Zoom Y in/out - increase or decrease the zoom level on the Y axis.
•
![]() Zoom X in/out - increase or decrease the zoom level on the X axis.
Zoom X in/out - increase or decrease the zoom level on the X axis.
•
![]() Reset Zoom - return the graph zoom state to the default values.
Reset Zoom - return the graph zoom state to the default values.
|
|
|
|
Linear scale. |
Log Scale showing low values. |
|
|
|
|
Low Smoothness. |
High Smoothness. |
Monitoring Contact Sheets
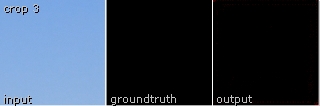
As the machine learning completes passes through the data set, as well as the graph in the Properties panel, you'll see a crop overlay grid in the Contact Sheet panel. As training progresses, you'll notice the output images change steadily from random garbage to replicate the groundtruth images.
Contact sheets allow you to see if your data set is aligned correctly and display a visual representation of how the network behaves on certain frames.
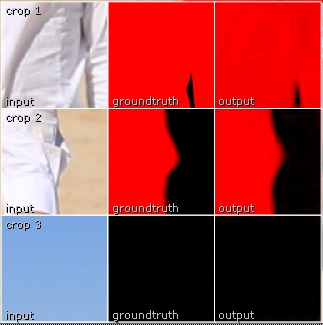
The overlay is split into three random crop rows, each with three columns. The size of the crop square is determined by the Crop Size control and generally, a larger area produces a better overall result. Some older GPUs may struggle with large Crop Size though, so you may have to reduce the area.
Each random crop row contains three images:
• input - a random sample from the Input side of the data set image pair. This is a frame from the source sequence that we'll apply the trained network to later on.
• groundtruth - the same sample area, but taken from the GroundTruth side of the data set image pair. This is what the network is learning to replicate.
• output - the same sample area, but with the effect that the network has learned so far applied to the source image.
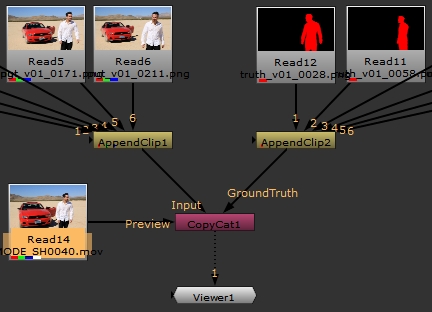
In the example, crop 1 and crop 2 have a reasonable approximation of the groundtruth shown in the output column.
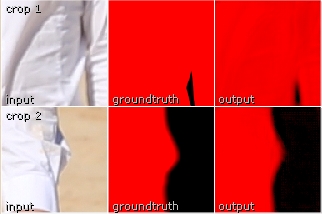
However, crop 3 is blank. This is because the groundtruth contains no alpha mask in that particular random crop.
Training a network requires both kinds of data to replicate the effect reliably, but you don't have to watch the Viewer overlay to evaluate progress. The overlay is saved as a contact sheet to the Data Directory every 100 steps by default. You can change how often a contact sheet is saved using the Contact Sheet Interval control in the Properties panel.
As training progresses, you'll see .png files populate the Data Directory at the specified Contact Sheet Interval. You can see how well the network is learning by examining the images over time. As training progresses, you'll notice the output images change steadily from random garbage in the first and second panels below to replicate the groundtruth images in later panels.
Tip: If the images in the output column appear to replicate the images in the groundtruth column before the training run finishes, you can stop training early. You don't have to complete the run if you see the result you want halfway through.

Previewing the Result
CopyCat's Preview input allows you to connect the source sequence so that you can view the machine learning progression in the Viewer. The Preview allows you to see how the training is progressing on frames outside the data set because the whole source sequence is connected to CopyCat.
You don't have to watch the Viewer overlay to evaluate progress, a preview .png file is saved to the Data Directory every 1000 steps by default. You can change how often a preview is saved using the Checkpoint Interval control in the Properties panel.

Reading the Results
You can examine the graph and contact sheets and previews in the Data Directory, but what indicates that you might need to tweak some settings or restart the training from a checkpoint or specific weighting?
Contact sheets are designed to be used alongside graph data, so you may not need to restart training if the contact sheet results are not perfect as long as the Step/Loss graph is trending toward zero on the Y axis.
• Check that you have connected the Input and Ground Truth images in the same order.
• Try adjusting the Model Size - more complex operations, such as beauty work, may require a larger Model Size.
• Try adjusting the Crop Size - higher resolution data sets may produce better models with a larger Crop Size.
• If the Step/Loss graph is trending toward zero, but the output column is still not replicating the groundtruth, try increasing the number of Epochs in the run.
• Add more image pairs to the data set - a diverse selection of images tends to produce the best results and the more frames you use, the better the results are likely to be. For example, if you're training a network to mask an object, try to pick frames that represent a wide variety of mask shapes.
If the Preview does not look correct on frames outside the data set, even if the graph is trending downwards and the contact sheet output column looks good, there may be image differences in the source sequence that are not represented by the Input and Ground Truth images you're using to train the network. These differences include defocus, different framing, shadows covering part of the effect, and so on.
• Add more image pairs to the data set - a diverse selection of images tends to produce the best results and the more frames you use, the better the results are likely to be. For example, if you're training a network to mask an object, try to pick frames that represent a wide variety of mask shapes.
• Try faking the effect on image pairs already in the data set. This can be particularly effective in certain situations such as shadows in the affected area.
Apply a trained network to a sequence using the Inference node.