Animating Parameters
Animating a parameter refers to changing its value over time. You do so by setting keyframes (frames at which you explicitly define a value) and allowing Nuke to interpolate the values in between. You can animate most of Nuke’s parameters in this manner.
Working with Animated Parameters
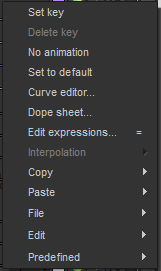
The Animation menu allows you to set key frames, delete keys, and perform other editing operations on the curves for animated parameters.
Setting Keyframes
To set keyframes, do the following:
| 1. | Use a Viewer to navigate to a frame where you want to place a key. |
| 2. | Click the animation button |
| 3. | Select Set key from the dropdown menu. The parameter’s input field turns blue, indicating that a keyframe has been inserted. Nuke switches to autokey mode: when you change the parameters value at another frame, it automatically inserts another keyframe for you. |
You can also set a key for all the controls in a node. To do so, right-click on a node's properties panel and select Set key on all knobs.
| 4. | Navigate to the next frame where you want to place a key. |
| 5. | Edit the parameter’s value using the input field, regular slider, or color slider. The moment you change the value, Nuke creates a keyframe. |
| 6. | Continue adding key frames as necessary. |
| 7. | Use the Viewer’s scrubber to preview the result. |
Deleting Keyframes
To delete a single keyframe:
| 1. | Use the Viewer’s next edit/keyframe and previous edit/keyframe buttons |
| 2. | Click the animation button |
| 3. | Select Delete key from the dropdown menu. |
Nuke removes the keyframe.
To delete all key frames from a parameter:
| 1. | Click the animation button. |
| 2. | Select No animation from the dropdown menu. |
A confirmation dialog appears.
| 3. | Click Yes. |
Nuke removes all key frames from the parameter, and sets the static value to match that of the current frame.
Linking Animated Parameters with Tracker
You can link any controls with others by using expressions (see Expressions), but you can also quickly and easily link with the Tracker node using the Link to option in the Animation menu. For example, to link the translate control of the RotoPaint node with a Tracker node, do the following:
| 1. | Create the Tracker node you want to link to. |
| 2. | On the Transform tab of the RotoPaint node’s control panel, click on the translate animation menu. |
| 3. | Select Link to > Tracker linking dialog... |
| 4. | Select the Tracker node you want to use in the tracker node dropdown and in the link to dropdown, select whether you want to link to the position of the track or the translate values of it. |
| 5. | Select which tracks you want to use by checking the track boxes. |
The expression fields update with the appropriate expression syntax.
| 6. | Then click OK, and your linking is done. |
Your Bezier shape’s translate value now changes when the Tracker value is changed.
Animated Parameters in the Dope Sheet and the Curve Editor
As you add keyframes to a parameter, Nuke automatically both adds markers to the Dope Sheet for them and plots a curve on its Curve Editor panel.
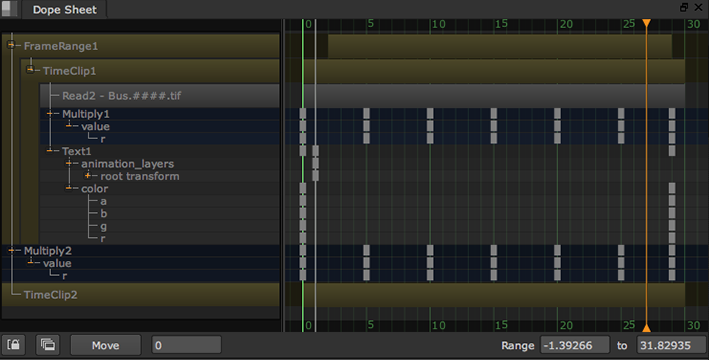
The Dope Sheet provides an easy way to edit keyframes as well as reposition, trim, and slip clips.
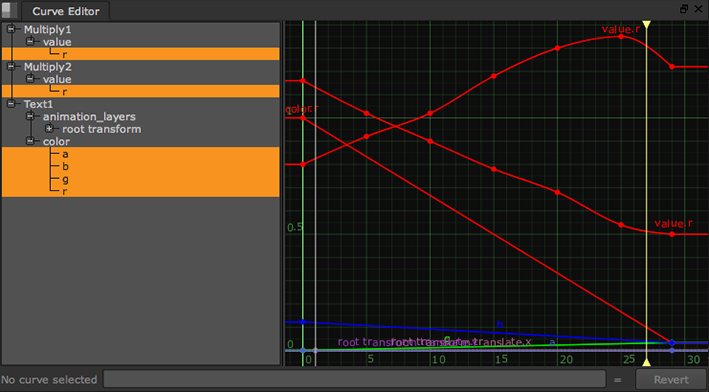
The Curve Editor allows you to adjust keyframes and the interpolation between them.
You can add key frames, delete key frames, and even adjust the interpolation between key frames without ever looking at the Dope Sheet or Curve Editor. However, as the animation grows more complex, you may find it easier to edit the animation by manipulating its keyframes directly. For more information on how to do so, see Editing Clips in the Dope Sheet and Using the Curve Editor.
Using the Dope Sheet
The Dope Sheet gives you access to all the keyframes you’ve created and provides an easy way of editing them. You can also use it to reposition, trim, and slip Read nodes and certain Time nodes.
Also see Using the Curve Editor.
Using the Dope Sheet Interface
To show the Dope Sheet, click the Dope Sheet tab. If you can’t see the tab, right-click the Node Graph title bar and select Windows > Dope Sheet.
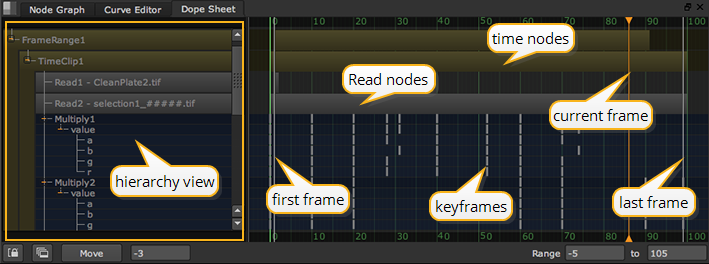
In the Dope Sheet, you can see the following:
|
Hierarchy view |
Click through the hierarchy view to see your nodes and a hierarchical list of animated controls. If you can’t see a node in the list, try opening its properties panel. To make a node appear in the Dope Sheet without having its properties panel open, select the dope sheet checkbox in the bottom of the Node tab of the node's properties panel. You can display the Read and TimeClip nodes in the Dope Sheet when their properties are closed, by clicking the middle button in the bottom-left of the Dope Sheet. |
|
Read nodes |
Any Read nodes that have their properties panels open display as gray bars in the Dope Sheet. |
|
Time nodes |
Any AppendClip, FrameRange, Retime, TimeOffset, TimeWarp, and TimeClip nodes that have their properties panels open display as green bars. |
|
Keyframes |
Your keyframes display as gray markers in the keyframe grid. If you go down to the lowest level of hierarchy, you can also view the keyframes set for different views in stereoscopic or multi-view projects. |
|
Current frame indicator |
The current frame indicator displays as an orange line. |
|
First and last frame in the project |
The first and last frame in the project's frame range (as defined in the Project Settings) display as white/gray lines. |
You can also use the following controls at the bottom of the Dope Sheet:
|
Control |
Description |
|---|---|

|
Synchronize the frame range of your project between the Dope Sheet and the Curve Editor. |

|
Display all Read and TimeClip nodes in the Dope Sheet. By default, only the nodes that have their properties panels open show up on the Dope Sheet. If you click this button, all Read and TimeClip nodes in your script are displayed in the Dope Sheet. If you click the button again, the default view is restored. |
|
|
Move the selected keyframes by the number of frames specified. You can enter negative values to move the keyframes backwards. Note: You cannot move keyframes past other keyframes. If you don't enter a number in the Move field, it shows the amount of your previous move. |
|
|
Set the frame range to display in the Dope Sheet. |
Viewing Keys in the Dope Sheet
To view keys in the Dope Sheet, you need to create some Read nodes, Time nodes, or keyframes first. The Dope Sheet displays:
• All the Read nodes that have their properties panels open.
• Any AppendClip, FrameRange, Retime, TimeOffset, TimeWarp, and TimeClip nodes that have their properties panels open.
• Any nodes that have keyframes set on them and have their properties panels open.
Tip: To force the above nodes to display in the Dope Sheet even when their properties aren't open, check the dope sheet box on the Node tab of the node’s properties panel or select the node in the Node Graph and press Alt+D.
Tip: If you want to view an AudioRead node under your keyframes, you can display it by right-clicking and selecting View > Audio > Draw Style > Below. For more information on the audio options, see Audio in Nuke.
The Dope Sheet and Time Nodes
If you have an AppendClip, FrameRange, Retime, TimeOffset, TimeWarp, or TimeClip node downstream of the node being animated, the Dope Sheet shows your keyframes in the context of the currently active Viewer. Whenever you change the Viewer input, the keys in the Dope Sheet move accordingly to reflect where their effect is actually seen in the Viewer:
• If you view keys before a node that moves them in time, you see them at their original time.
• If you view keys after the time manipulation, you see them shifted by the time operation.
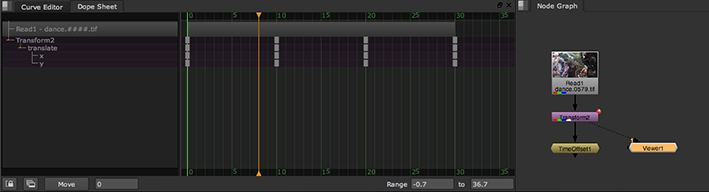
For example, in the below script, the Transform node has been animated on frames 0, 10, 20, and 30. When the Viewer is connected to the Transform node, the Dope Sheet shows keys on those frames.
There is also a TimeOffset node in the script, set to move the input clip 5 frames forward in time. When the Viewer is connected to the TimeOffset node, the Dope Sheet shows the keys shifted by 5 frames - on frames 5, 15, 25, and 35.
Multiple Branches of Nodes in the Dope Sheet
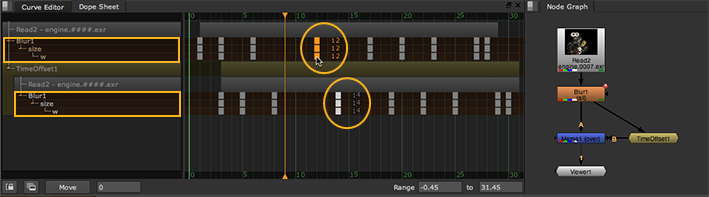
If there are multiple paths from an animated node to the currently active Viewer, the keyframes for the animated node appear in the Dope Sheet multiple times. For example, in the below script, there are two paths from the animated Blur node to the Viewer:
• Blur > Merge > Viewer
• Blur > TimeOffset > Merge > Viewer
As a result, the keyframes for the Blur node appear in the Dope Sheet twice. Adjusting the keys in one location also updates them in the other.

Selecting Keyframes
There are several ways to select and edit different keyframes:
|
Select multiple frames |
Drag a marquee over your keyframes in the keyframe view. |
| Add or remove keyframes from a marquee selection | Hold Shift and drag another marquee around some of the selected keyframes. |
| Select a single keyframe | Click it in the keyframe view. Its parent keyframe and all other keyframes depending on it are selected too. The frame number of the keyframe is displayed next to it. |
| Select all keyframes in one node | Click the node name in the hierarchy view. All the child keyframes under that node are selected. |
If there are multiple paths from an animated node to the currently active Viewer, the keyframes for the animated node appear in the Dope Sheet multiple times. When you select them in one location, they turn orange, while the corresponding keys in other locations turn white.
Note: When selecting keys that appear in the Dope Sheet multiple times (using multiple paths), marquee selection is constrained to one path only.
Copying and Pasting
You can copy and paste keyframes in the Dope Sheet. After selecting the keyframe(s) you want to copy, use the Ctrl/Cmd+C keyboard shortcut to copy the keyframe(s), and Ctrl/Cmd+V to paste them in another location of the Dope Sheet.
When using the Ctrl/Cmd+V keyboard shortcut, pasting keyframes is relative to the location of the current frame indicator. In other words, if you have keyframes at 1, 10, and 20 and you copy this selection before pasting the selection at frame 21, new keyframes are set at frames 21, 30, and 40.
To paste keyframes on the same frame as the source keys, select the control you want to receive the keys, right-click on the Dope Sheet, and select Edit > Paste > Paste Absolute.
Deleting and Adding Keyframes
You can remove keyframes in the Dope Sheet. To delete a keyframe, just select it and press Delete/Backspace button or right-click on the keyframe and select Edit > Erase.
You can also add keyframes in the Dope Sheet to add animation where there isn’t any at the moment. Add keyframes by Ctrl/Cmd+Alt+clicking on an empty spot in the Dope sheet. A new keyframe is created and you can adjust it as necessary.
Editing Clips in the Dope Sheet
The Dope Sheet allows you to easily reposition, trim, and slip your clips as well as set a frame range for them:
• Repositioning clips refers to changing the position, but not the content or the duration, of the clip. In the Dope Sheet, you can reposition clips using the Read, TimeOffset, and TimeClip nodes.
• Trimming clips refers to removing unwanted frames from the head or tail of the clip. In the Dope Sheet, you can trim clips using the Read and TimeClip nodes.
• Slipping clips refers to changing the content of the clip that is seen, but not the position or duration. In the Dope Sheet, you can slip clips using the Read and TimeClip nodes.
• Setting a frame range for a clip controls which frames a downstream AppendClip node uses from the input, which frames are displayed in the Viewer when the timeline range dropdown menu is set to Input, and which frames are sent to the flipbook. In the Dope Sheet, you can set the frame range for a clip using the FrameRange node.
Repositioning, Trimming, and Slipping Clips Using Read and TimeClip Nodes
• To reposition a clip, place the cursor over the Read or TimeClip bar in the Dope Sheet and drag left or right.
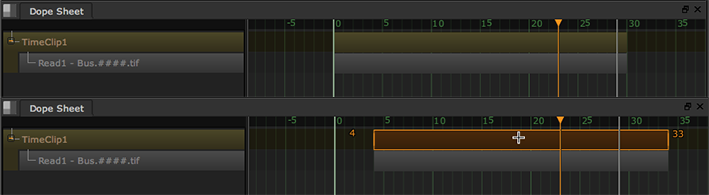
The new start and end frame numbers are displayed on either side of the bar, and the frameoffset control in the Read or TimeClip properties panel is adjusted automatically.
Tip: You can also reposition a clip by selecting the bar, double-clicking on the first and last frame numbers next to it, and adjusting them in the x fields that pop up.
• To trim a clip, place the cursor in the beginning or end of the bar and drag left or right.
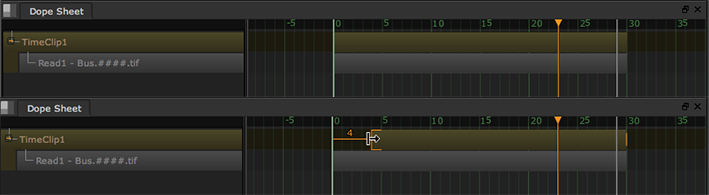
The new start or end frame is displayed next to the bar, and an orange line appears to represent the original frame range. The framerange control in the Read or TimeClip properties panel is adjusted automatically.
Tip: You can also trim a clip by selecting the bar, double-clicking on the first or last frame number next to it, and adjusting the number in the x field that pops up.
Tip: The number of frames you can trim from either end of a clip is constrained by the clip's original frame range. However, if necessary, you can trim beyond the original range by holding Ctrl/Cmd while trimming.
If necessary, you can change how the clip displays inside the clip handles (the unused frames beyond the start or end of the clip). Adjust the before and after dropdown menus next to the frame range control in the Read or TimeClip properties to change what happens before and after the frame range limits:
• hold - select to show a still picture of the first/last frame of the frame range.
• loop - select to start over and keep looping the span of the frame range outside the first/last frame of the frame range.
• bounce - select to play the span of the frame range backwards and forwards between the frame range limits.
• black - select to display a black frame outside of the first/last frame.
• To slip a clip, first trim the clip to create clip handles. Then, place the cursor over the bottom half of the bar and drag left or right.
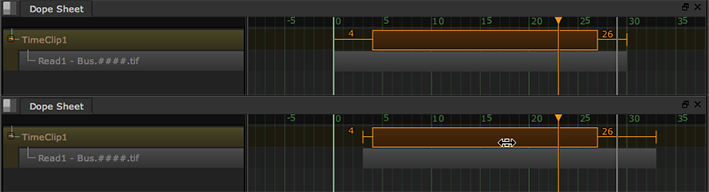
The clip handles move to indicate what portion of the clip is visible. The frame range and frame offset controls in the Read or TimeClip properties panel are adjusted automatically.
Tip: The number of frames you can slip a clip by is constrained by the clip's original frame range. However, if necessary, you can slip beyond the original range by holding Ctrl/Cmd while slipping.
Repositioning Clips Using TimeOffset Nodes
To reposition a clip, place the cursor over the TimeOffset bar in the Dope Sheet and drag left or right.
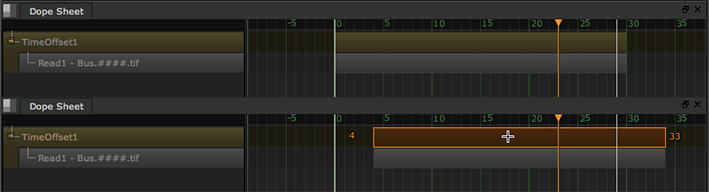
The new start and end frame numbers are displayed on either side of the bar, and the time offset (frames) control in the TimeOffset properties panel is adjusted automatically.
Tip: You can also reposition a clip by selecting the bar, double-clicking on the first and last frame numbers next to it, and adjusting them in the x fields that pop up.
To Set the Frame Range Using FrameRange Nodes
• To set both the first and the last frame for a clip, place the cursor over the FrameRange bar in the Dope Sheet and drag left or right.
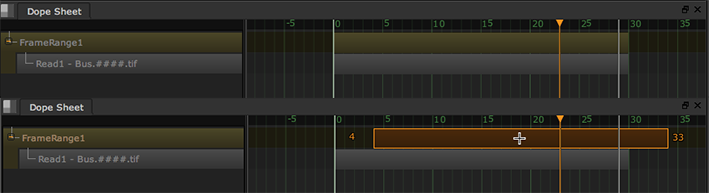
The new start and end frame numbers are displayed on either side of the bar, and the frame range control in the FrameRange properties panel is adjusted automatically.
• To set only the first or the last frame for a clip, place the cursor in the beginning or end of the bar and drag left or right.
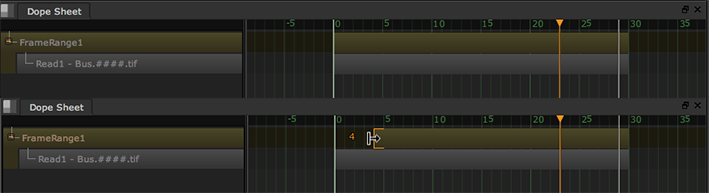
The new start or end frame is displayed next to the bar, and the frame range control in the FrameRange properties panel is adjusted automatically.
Tip: You can also set the frame range for a clip by selecting the bar, double-clicking on the first and last frame numbers next to it, and adjusting them in the x fields that pop up.
Synchronizing the Frame Range
You can synchronize the frame range of your project between the Dope Sheet and the Curve Editor. This is useful when you’re using both of them to edit your animation curves and keyframes at the same time. To synchronize the frame range:
| 1. | Right-click anywhere on the Dope Sheet. |
| 2. | Select View > Synchronize frame range. Any changes you now make to the frame range in the Dope Sheet are applied in the Curve Editor too, and any changes you make in the Curve Editor are also reflected in the Dope Sheet. Zooming in and out in either also zooms the other view. |
Tip: You can also do this by clicking the synchronize button at the bottom of the Dope Sheet.
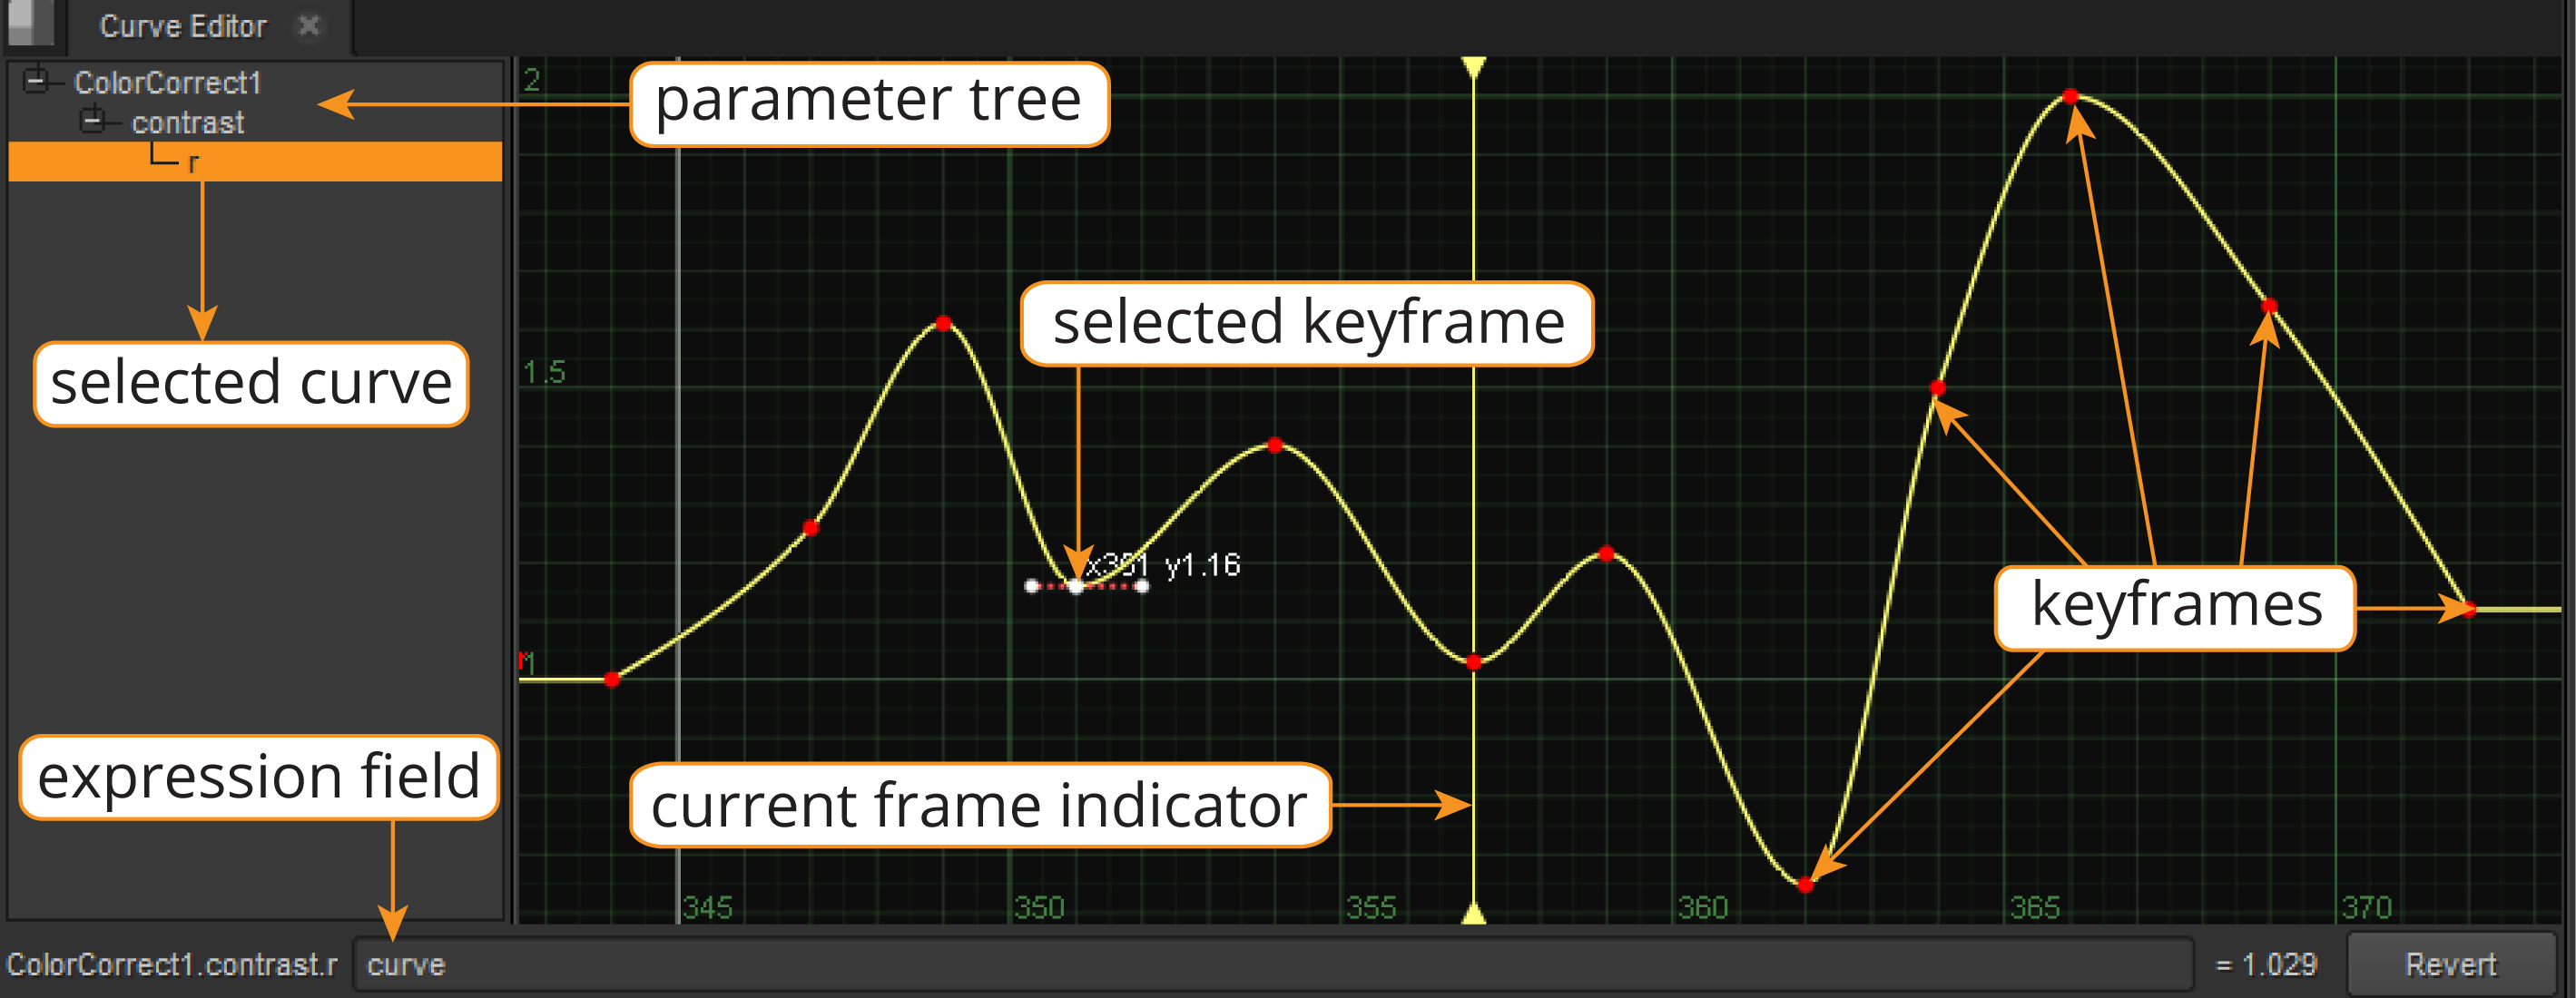
Using the Curve Editor
The Curve Editor enables you to edit curves without physically entering information in the Properties pane.
Displaying an Animation Curve
To reveal an animation curve, do the following:
| 1. | Click the animation button |
| 2. | Select Curve Editor. The Curve Editor panel appears with a focus on the selected parameter’s curve. |
The vertical, or y axis, denotes the value of the parameter.
The horizontal, or x axis, denotes time (in frame units).
Displaying Curves in the Editor
To display curves in the editor, do the following:
| 1. | In the parameter tree on the left, click the + and - signs to expand and collapse the hierarchy as necessary. |
| 2. | Click a parameter’s name to make its curve the focus of the editor. To focus on multiple curves at the same time, either: |
• Hold Shift and click on curves to create a consecutive list,
OR
• Hold Ctrl/Cmd and click on individual curves to add them to the selection.
| 3. | To display separate curves for each channel, separate the channels for the relevant control in the node’s properties panel. |
The parameter tree on the left allows you to focus on any curve in the script.
Tip: If you want to view an AudioRead node under your animation curves, you can display it by right-clicking anywhere in the curve editor and selecting View > Audio > Draw Style > Below. For more information on the audio options, see Audio in Nuke.
Enabling/Disable a Curve in the Editor
To enable or disable a curve in the Editor, in the parameter tree on the left, click the + and - signs to expand and collapse the hierarchy as necessary.
Zooming In or Out in the Editor
To zoom in or out in the Editor, do the following:
| 1. | Click on the area you want to zoom in on or out of. |
| 2. | Press the + button to zoom in, or the - button to zoom out, |
OR
Scroll up with the mouse wheel to zoom in, or down to zoom out.
Tip: Depending on your mouse preferences, you can zoom to a custom area in the Curve Editor, middle-click on the Editor and drag to select an area with a marquee. When you release the mouse button, the Editor zooms to fit the selected area in the Editor.
Panning in the Editor
To pan in the Editor, hold the middle-mouse button and drag over the Editor. You can also use Alt+drag.
Resetting Zoom and Panning
To reset the zoom or panning:
| 1. | Right-click on the Curve Editor. |
| 2. | From the menu that opens, select View > Frame All. |
OR
Press A on the Editor.
OR
Click the middle-mouse button (dependent on your mouse preferences).
Nuke centers the curve in the Editor, resetting the zoom.
Centering a Portion of the Curve
To center a point of the curve in the Editor:
| 1. | Select the points you want to center in the editor. |
| 2. | Right-click on the Editor, and select View > Frame Selected (or press F on the Editor). |
Nuke centers the selected portion of the curve in the editor. If no points are selected, Nuke centers the selected curve, or all curves.
Editing Curves
You edit curves by moving the points on the curve to new locations. If necessary, you can add more points to the curve. You can also sketch curves freely, use the usual editing functions such as copy and paste, smooth curves with filtering, interpolate curves, loop, reverse or negate curves, and use expressions to modify curves.
Adding Points to a Curve
To add points to a curve, do the following:
| 1. | Click on the curve you want to edit. The curve turns yellow to indicate it’s selected. |
| 2. | Ctrl/Cmd+Alt+click on the part of the Curve Editor you want to add a point to. You can add points both on the curve and outside the curve, |
OR
| 1. | Right-click on the Editor and select Edit > Generate. The Generate keys dialog opens. |
| 2. | In the Start at field, enter the first frame you want to use as a keyframe. |
| 3. | In the End at field, enter the last frame you want to use as a keyframe. |
| 4. | In the Increment field, enter the frame increment you want to use between the first and the last keyframe. For example, if you want every tenth frame to be a keyframe, enter 10. |
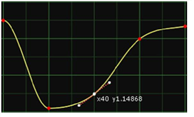
| 5. | In the last field, enter the value you want to use for y. If you do not enter a value here, the key frames are added to the current curve without modifying the curve shape. |
| 6. | Click OK. |
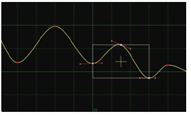
Selecting Points on a Curve
You can select points in the following ways:
• To select individual points, click on the point you want to select.
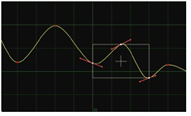
• To select multiple points, Shift+click on the points, or drag a marquee around them.
A box is drawn around the points to indicate they have been selected.
• To select all points, press Ctrl+A (Mac users press Cmd+A).
A box is drawn around the points to indicate they have been selected.
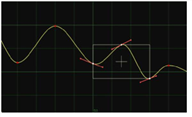
Moving Points on a Curve
• To move a point along either the x or y axis only, drag the point to a new location.
• To move a point in any direction, Ctrl+drag (Mac users Cmd+drag) the point to a new location. You can also nudge points using the numeric keypad arrows.
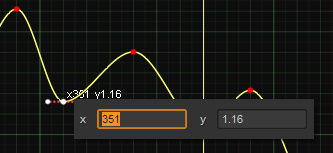
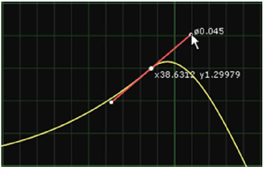
• To adjust the values of a point numerically, select the point and double-click on the x or y value that appears next to it.
• By default, when you move a point, its position on the x axis is rounded to the nearest integer. To disable this, you can right-click on the Curve Editor and select Edit > Frame Snap. You can also momentarily disable the snapping by pressing Shift while moving a point.
• To move several points at the same time, select them and drag the selection box to a new location.
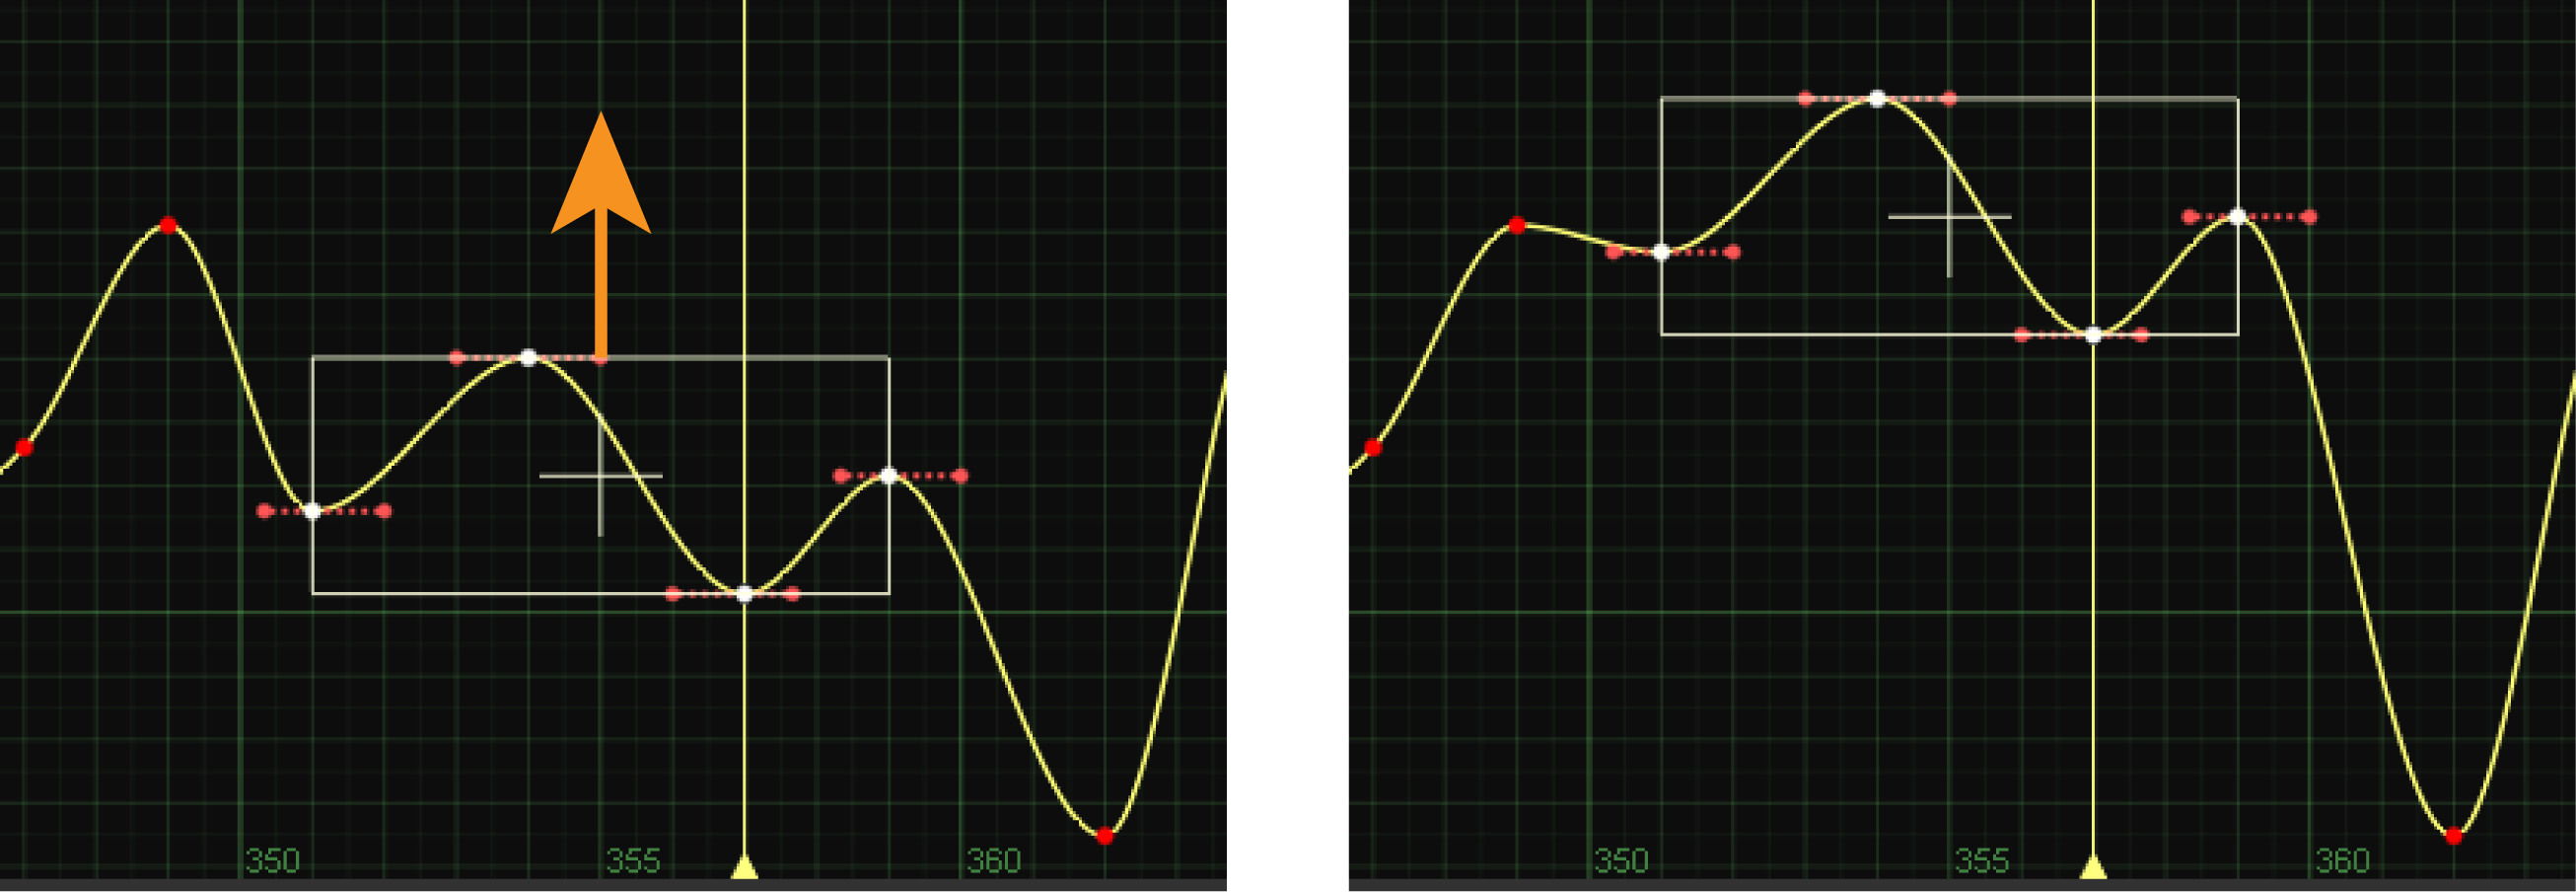
To add or remove points to or from the selection box, Shift+click on the points.
To resize and scale the selection box, drag its edges. If the selection box is very narrow, you can press Ctrl/Cmd when resizing it. This allows you to resize the box in one dimension only. For example, if you have a box that’s wide on the x axis but flat on the y axis, you can resize it in this way along the x axis.
To avoid accidentally moving a point inside the selection box, press Ctrl/Cmd+Shift when dragging the box to hide the points inside the box.
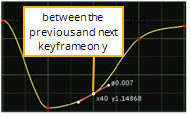
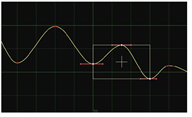
Adjusting the Slope Around the Points
To adjust the slope around the points, do the following:
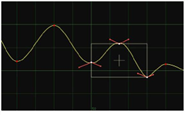
| 1. | Select a point on the curve. Red tangent handles appear on both sides of the point. |
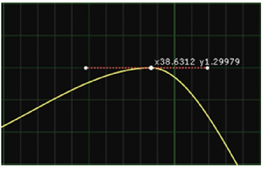
| 2. | Drag the tangent handles to a new location. The curve follows the handles. |
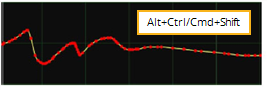
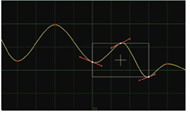
Sketching a Curve
You can sketch a curve freely by doing the following:
Press Alt+Ctrl+Shift (Mac users press Alt+Cmd+Shift) while drawing a curve on the editor. Nuke sketches a curve that follows your mouse movements.
Cutting, Copying, and Pasting
You can cut, copy, or paste any selected points, expressions, or curves, by doing the following:
| 1. | Right-click on the Curve Editor. |
| 2. | From the menu that opens, select Edit and the editing function you want to use on the entire curve, for example: |
• Edit > Copy > Copy Selected Keys to only copy the points you have currently selected.
• Edit > Copy > Copy Curves to copy an entire curve.
• Edit > Copy > Copy Expressions to copy the expression that creates the curve.
• Edit > Copy > Copy Links to copy a curve and keep its values linked to the original curve, so that if you change the original, your changes also affect the copied curve.
Move Selected Points on the Curve
To move selected points on the curve by a fixed value:
| 1. | Select all the points you want to move. |
| 2. | Right-click on the editor and select Edit > Move. The Move Animation Keys dialog opens. |
| 3. | In the x and y fields, define how you want to move the points along the x and y axes. For example, to shift the selected points to the right by a value of 10, enter x+10 in the x field. |
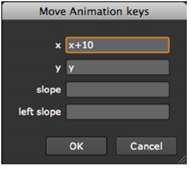
| 4. | In the slope and left slope fields, define how you want to move the points’ tangent handles. |
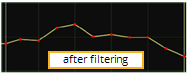
Smoothing the Curve
To smooth the curve with filtering, do the following:
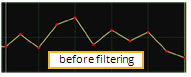
| 1. | Select the portion of the curve that needs smoothing. |
| 2. | Right-click on the editor and select Edit > Filter. The Filter Multiple dialog opens. |
| 3. | In the No. of times to filter field, specify how many times you want to filter the curve. Filtering sets new values on each point based on the average values of their neighboring points. The more filtering, the smoother the curve. |
Interpolating Parts of a Curve
You can interpolate parts of a curve, by doing the following:
| 1. | Select the point(s) between or around which you want to interpolate the curve. |
| 2. | Right-click on the Editor. Select Interpolation and the type of interpolation you want to use. Select: |
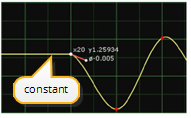
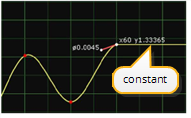
• Constant to force a constant value after each selected point.

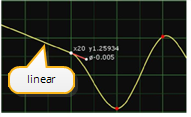
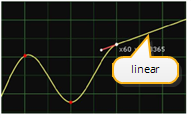
• Linear to use linear interpolation. This produces sharp changes at key frames and straight lines between them.

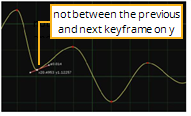
• Smooth to set the tangents’ slopes equal to the slope between the keyframe to the left and the keyframe to the right if the selected point is between these two key frames along the y axis. If the selected point is not between these key frames and has a larger or smaller value than both key frames, the tangents’ slopes are made horizontal. This ensures the resulting curve never exceeds the keyframe value.
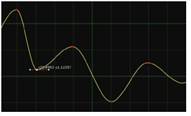
• Catmull-Rom to set the tangents’ slope equal to the slope between the keyframe to the left and the keyframe to the right regardless of where the selected point is located. The resulting curve can exceed the keyframe values.

• Cubic to set the slope so that the second derivative is continuous. This smooths the curve.

• Horizontal to make the tangents horizontal, setting the slope around the selected points to zero.
• Break to adjust the two tangents of a selected point independent of each other.
• Before > Constant or Linear to interpolate the parts of the curve that are on the left side of the first point. This option only works if you have selected the first point on the curve.
• After > Constant or Linear to only interpolate the parts of the curve that are on the right side of the last point. This option only works if you have selected the last point on the curve.
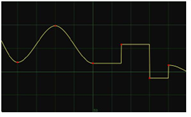
Repeating a Part of the Curve
To repeat a portion of the curve, throughout the curve, do the following:
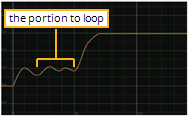
| 1. | Right-click on the editor and select Predefined > Loop. The Loop dialogue opens. |
| 2. | In the First frame of loop field, enter first frame of the portion you want to repeat throughout the curve. |
| 3. | In the Last frame of loop field, enter the last frame of the portion you want to repeat. |
| 4. | Click OK. |
The shape of the curve between these frames is repeated throughout the rest of the curve. The solid line represents the actual curve, and the dotted line the original curve with the key frames.
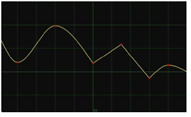
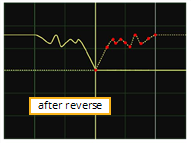
Reversing a Curve
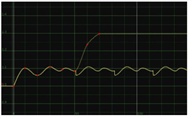
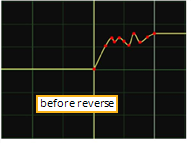
You can reverse a curve by right-clicking on the editor and select Predefined > Reverse.
This makes the curve go backward in time. Both the new curve and the original curve are displayed. The solid line represents the actual curve, and the dotted line contains the key frames that you can modify.
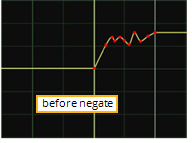
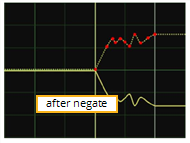
Negating a Curve
You can negate a curve by right-clicking on the editor and select Predefined > Negate.
The curve becomes the negative of the key frames. For example, a value of 5 turns into -5. Both the new curve and the original curve are displayed. The solid line represents the actual curve, and the dotted line contains the key frames that you can modify.
Modifying a Curve with an Expression
You can modify a curve using an expression by doing the following:
| 1. | Enter the expression in the expression field at the bottom of the Curve Editor, |
| 2. | Click the Revert button to set the field back to previous valid expression. |
OR
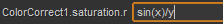
| 1. | Right-click on the Editor, and select Edit > Edit expression. |
| 2. | In the dialog that opens, type the expression you want to use for the curve, for example, sin(x)/x. |
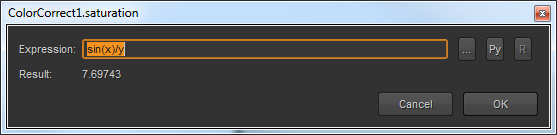
| 3. | Click OK. |